2004 ISUZU TF SERIES sensor
[x] Cancel search: sensorPage 1445 of 4264
4JA1/4JH1 ENGINE DRIVEABILITY AND EMISSIONS 6E–73
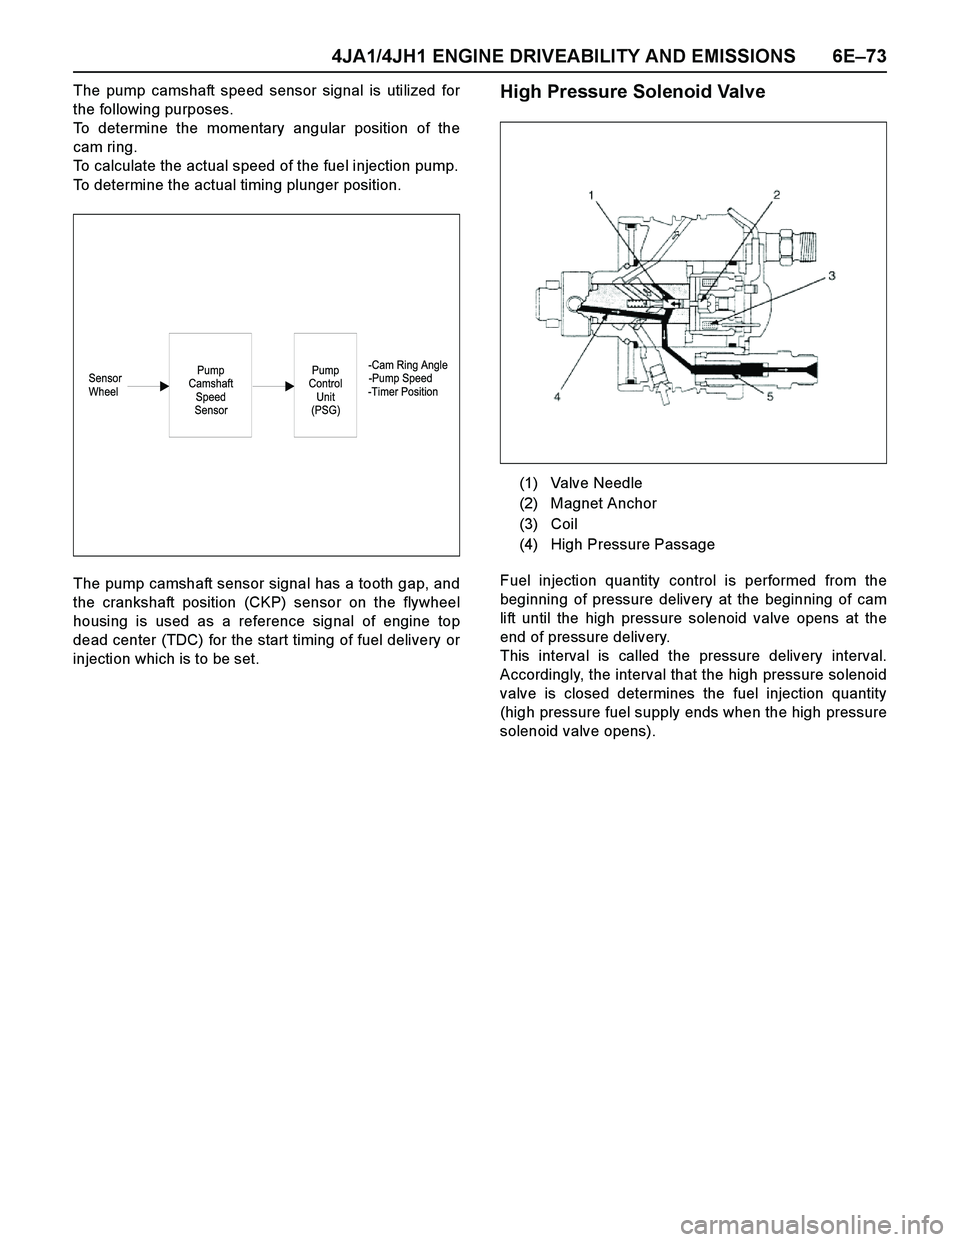
The pump camshaft speed sensor signal is utilized for
the following purposes.
To determine the momentary angular position of the
cam ring.
To calculate the actual speed of the fuel injection pump.
To determine the actual timing plunger position.
The pump camshaft sensor signal has a tooth gap, and
the crankshaft position (CKP) sensor on the flywheel
housing is used as a reference signal of engine top
dead center (TDC) for the start timing of fuel delivery or
injection which is to be set.High Pressure Solenoid Valve
Fuel injection quantity control is performed from the
beginning of pressure delivery at the beginning of cam
lift until the high pressure solenoid valve opens at the
end of pressure delivery.
This interval is called the pressure delivery interval.
Accordingly, the interval that the high pressure solenoid
valve is closed determines the fuel injection quantity
(high pressure fuel supply ends when the high pressure
solenoid valve opens).
-Cam Ring Angle
Sensor -Pump Speed
Wheel -Timer PositionPump
Control
Unit
(PSG)Pump
Camshaft
Speed
Sensor
(1) Valve Needle
(2) Magnet Anchor
(3) Coil
(4) High Pressure Passage
Page 1447 of 4264
4JA1/4JH1 ENGINE DRIVEABILITY AND EMISSIONS 6E–75
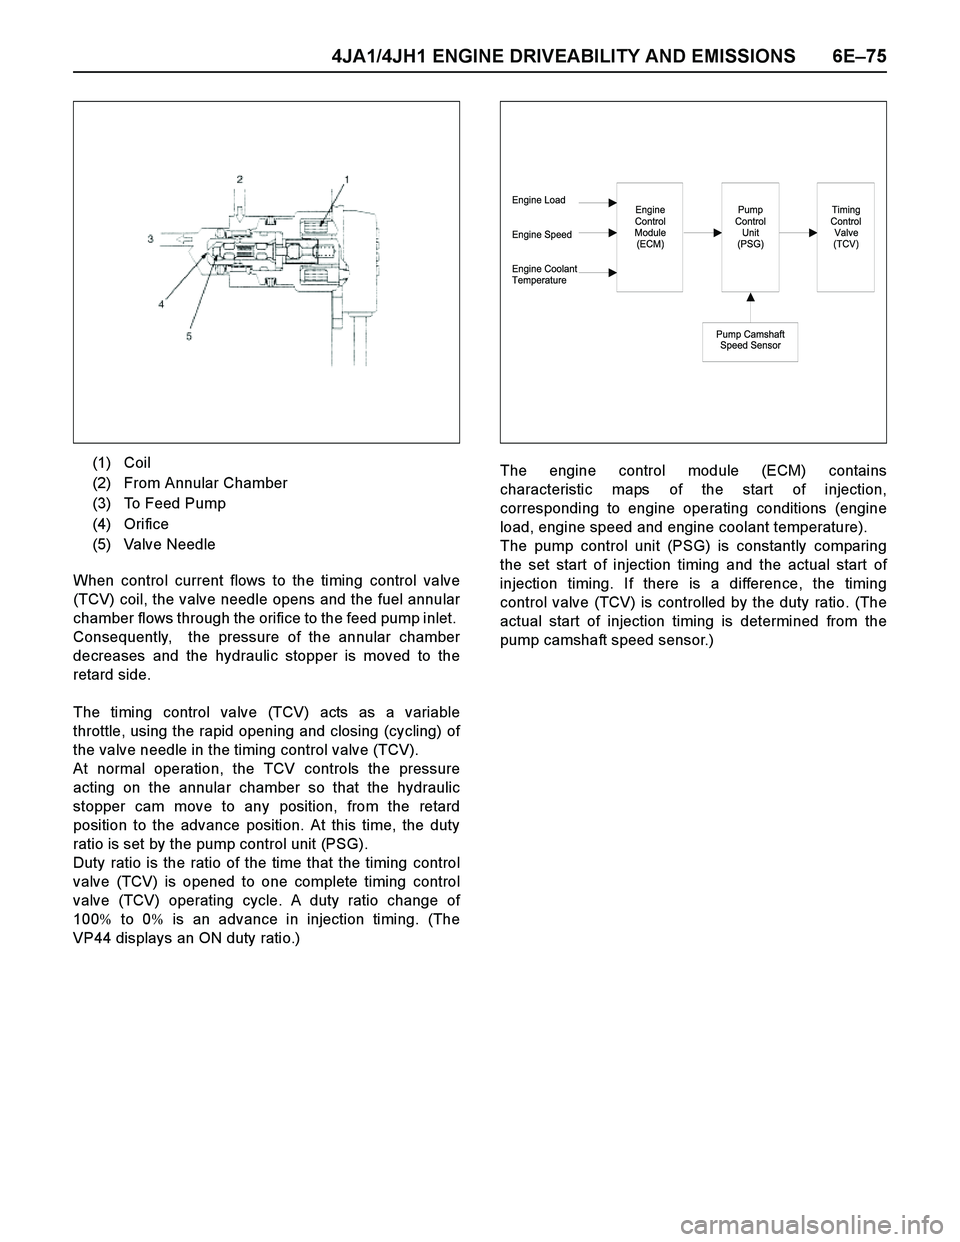
When control current flows to the timing control valve
(TCV) coil, the valve needle opens and the fuel annular
chamber flows through the orifice to the feed pump inlet.
Consequently, the pressure of the annular chamber
decreases and the hydraulic stopper is moved to the
retard side.
The timing control valve (TCV) acts as a variable
throttle, using the rapid opening and closing (cycling) of
the valve needle in the timing control valve (TCV).
At normal operation, the TCV controls the pressure
acting on the annular chamber so that the hydraulic
stopper cam move to any position, from the retard
position to the advance position. At this time, the duty
ratio is set by the pump control unit (PSG).
Duty ratio is the ratio of the time that the timing control
valve (TCV) is opened to one complete timing control
valve (TCV) operating cycle. A duty ratio change of
100% to 0% is an advance in injection timing. (The
VP44 displays an ON duty ratio.)The engine control module (ECM) contains
characteristic maps of the start of injection,
corresponding to engine operating conditions (engine
load, engine speed and engine coolant temperature).
The pump control unit (PSG) is constantly comparing
the set start of injection timing and the actual start of
injection timing. If there is a difference, the timing
control valve (TCV) is controlled by the duty ratio. (The
actual start of injection timing is determined from the
pump camshaft speed sensor.) (1) Coil
(2) From Annular Chamber
(3) To Feed Pump
(4) Orifice
(5) Valve Needle
Engine Load
Engine Speed
Engine Coolant
TemperatureEngine
Control
Module
(ECM)Pump
Control
Unit
(PSG)
Pump Camshaft
Speed Sensor
Timing
Control
Valve
(TCV)
Page 1450 of 4264
6E–78 4JA1/4JH1 ENGINE DRIVEABILITY AND EMISSIONS
3. Check Bulletins and
Troubleshooting Hints
NOTE: As estimated 30 percent of successful vehicle
repairs are diagnosed with this step!
What you should do
You should have enough information gained from
preliminary checks to accurately search for a bulletin
and other related service information. Some service
manual sections provide troubleshooting hints that
match symptoms with specific complaints.
What resources you should use
You should use the following resources for assistance in
checking for bulletins and troubleshooting hints:
Printed bulletins
Access ISUZU Bulletin Web site.
Videotapes
Service manual
4. Perform Service Manual
Diagnostic Checks
What you should do
The “System Checks” in most service manual sections
and in most cells of section 8A (electrical) provide you
with:
A systematic approach to narrowing down the
possible causes of a system fault
Direction to specific diagnostic procedures in the
service manual
Assistance to identify what systems work correctly
What resources you should use
Whenever possible, you should use the following
resources to perform service manual checks:
Service manual
Technical equipment (for viewing DTCs and
analyzing data)
Digital multimeter and circuit testing tools
Other tools as needed
5a and 5b. Perform Service Manual
Diagnostic Procedures
NOTE: An estimated 40 percent of successful vehicle
repairs are diagnosed with these steps!
What you should do
When directed by service manual diagnostic checks,
you must then carefully and accurately perform the
steps of diagnostic procedures to locate the fault relatedto the customer complaint.
What resources you should use
Whenever appropriate, you should use the following
resources to perform service manual diagnostic
procedures:
Service manual
Technical equipment (for analyzing diagnostic data)
Digital multimeter and circuit testing tools
Essential and special tools
5c. Technician Self Diagnoses
When there is no DTC stored and no matching
symptom for the condition identified in the service
manual, you must begin with a thorough understanding
of how the system(s) operates. Efficient use of the
service manual combined with you ex perience and a
good process of elimination will result in accurate
diagnosis of the condition.
What you should do
Step 1: Identify and understand the suspect
circuit(s)
Having completed steps 1 through 4 of the Strategy
Based Diagnostics chart, you should have enough
information to identify the system(s) or sub-system(s)
involved. Using the service manual, you should
determine and investigate the following circuit
characteristics:
Electrical:
–How is the circuit powered (power distribution
charts and/or fuse block details)?
–How is the circuit grounded (ground distribution
charts)?
–How is the circuit controlled or sensed (theory of
operation):
–If it is a switched circuit, is it normally open or
normally closed?
–Is the power switched or is the ground
switched?
–Is it a variable resistance circuit (ECT sensor
or TP sensor, for ex ample)?
–Is it a signal generating device (MAF sensor of
VSS, for example)?
–Does it rely on some mechanical/vacuum
device to operate?
Physical:
–Where are the circuit components (component
locators and wire harness routing diagrams):
–Are there areas where wires could be chafed
or pinched (brackets or frames)?
–Are there areas subjected to ex treme
temperatures?
Page 1452 of 4264
6E–80 4JA1/4JH1 ENGINE DRIVEABILITY AND EMISSIONS
Step 3: Simulate the symptom and isolate the
problem
Simulate the symptom and isolate the system by
reproducing all possible conditions suggested in Step 1
while monitoring suspected circuits/components/
systems to isolate the problem symptom. Begin with the
most logical circuit/component.
Isolate the circuit by dividing the suspect system into
simpler circuits. Nex t, confine the problem into a smaller
area of the system. Begin at the most logical point (or
point of easiest access) and thoroughly check the
isolated circuit for the fault, using basic circuit tests.
Hints
You can isolate a circuit by:
Unplugging connectors or removing a fuse to
separate one part of the circuit from another
If only component fails to operate, begin testing the
component
If a number of components do not operate, begin test
at areas of commonality (such as power sources,
ground circuits, switches, main connectors or major
components)
Substitute a known good part from the parts
department or the vehicle system
Try the suspect part in a known good vehicle
See Symptom Simulation Tests on the nex t page for
problem simulation procedures. Refer to service manual
sections 6E and 8A for information about intermittent
diagnosis. Follow procedures for basic circuit testing in
service manual section 8A.
What resources you should use
Whenever appropriate, you should use the following
resources to assist in the diagnostic process:
Service manual
Bulletins
Digital multimeter (with a MIN/MAX feature)
Tech II and Tech II upload function
Circuit testing tools (including connector kits/
harnesses and jumper wires)
Ex perience
Intermittent problem solving simulation methods
Customer complaint check sheet
Symptom Simulation Tests
1. Vibration
This method is useful when the customer complaint
analysis indicates that the problem occurs when the
vehicle/system undergoes some form of vibration.
For connectors and wire harness, slightly shake
vertically and horizontally. Inspect the connector joint
and body for damage. Also, tapping lightly along a
suspected circuit may be helpful.For parts and sensors, apply slight vibration to the part
with a light tap of the finger while monitoring the system
for a malfunction.
2. Heat
This method is important when the complaint suggests
that the problem occurs in a heated environment. Apply
moderate heat to the component with a hair drier or
similar tool while monitoring the system for a
malfunction.
CA UTION: Care must be take to avoid overheating
the component.
3. Water and Moisture
This method may be used when the complaint suggests
that the malfunction occurs on a rainy day or under
conditions of high humidity. In this case, apply water in a
light spray on the vehicle to duplicate the problem.
CA UTION: Care must be take to avoid directly
exposing electrical connections to water.
4. Electrical loads
This method involves turning systems ON (such as the
blower, lights or rear window defogger) to create a load
on the vehicle electrical system at the same time you
are monitoring the suspect circuit/component.
5e. Vehicle Operates as Designed
This condition refers to instances where a system
operating as designed is perceived to be unsatisfactory
or undesirable. In general, this is due to:
A lack of understanding by the customer
A conflict between customer ex pectations and
vehicle design intent
A system performance that is unacceptable to the
customer
What you should do
You can verify that a system is operating as designed
by:
Reviewing service manual functional/diagnostic
checks
Ex amining bulletins and other service information for
supplementary information
Compare system operation to an identical vehicle
If the condition is due to a customer misunderstanding
or a conflict between customer ex pectation and system
operation, you should ex plain the system operation to
the customer.
If the complaint is due to a case of unsatisfactory
system performance, you should contact Technical
Assistance for the latest information.
What resources you should use
Whenever possible, you should use the following
resources to facilitate the diagnostic process:
Page 1454 of 4264
6E–82 4JA1/4JH1 ENGINE DRIVEABILITY AND EMISSIONS
GENERAL SERVICE INFORMATION
Serviceability Issues
Non-OEM Parts
All of the OBD diagnostics have been calibrated to run
with OEM parts. Accordingly, if commercially sold
sensor or switch is installed, it makes a wrong diagnosis
and turns on the check engine lamp.
Aftermarket electronics, such as cellular phones,
stereos, and anti-theft devices, may radiate EMI into the
control system if they are improperly installed. This may
cause a false sensor reading and turn on the check
engine lamp.
Poor Vehicle Maintenance
The sensitivity of OBD diagnostics will cause the check
engine lamp to turn on if the vehicle is not maintained
properly. Restricted oil filters, fuel filters, and crankcase
deposits due to lack of oil changes or improper oil
viscosity can trigger actual vehicle faults that were not
previously monitored prior to OBD. Poor vehicle
maintenance can not be classified as a “non-vehicle
fault”, but with the sensitivity of OBD diagnostics,
vehicle maintenance schedules must be more closely
followed.
Related System Faults
Many of the OBD system diagnostics will not run if the
ECM detects a fault on a related system or component.
Visual/Physical Engine Compartment
Inspection
Perform a careful visual and physical engine
compartment inspection when performing any
diagnostic procedure or diagnosing the cause of an
emission test failure. This can often lead to repairing a
problem without further steps. Use the following
guidelines when performing a visual/physical
inspection:
Inspect all vacuum hoses for punches, cuts,
disconnects, and correct routing.
Inspect hoses that are difficult to see behind other
components.
Inspect all wires in the engine compartment for
proper connections, burned or chafed spots, pinched
wires, contact with sharp edges or contact with hot
exhaust manifolds or pipes.
Basic Knowledge of Tools Required
NOTE: Lack of basic knowledge of this powertrain
when performing diagnostic procedures could result in
an incorrect diagnosis or damage to powertrain
components. Do not attempt to diagnose a powertrain
problem without this basic knowledge.
A basic understanding of hand tools is necessary to
effectively use this section of the Service Manual.
ON-BOARD DIAGNOSTIC (OBD)
On-Board Diagnostic (Self Diagnosis
System) Tests
A diagnostic test is a series of steps, the result of which
is a pass or fail reported to the diagnostic ex ecutive.
When a diagnostic test reports a pass result, the
diagnostic ex ecutive records the following data:
The diagnostic test has been completed since the
last ignition cycle.
The diagnostic test has passed during the current
ignition cycle.
The fault identified by the diagnostic test is not
currently active.
When a diagnostic test reports a fail result, the
diagnostic ex ecutive records the following data:
The diagnostic test has been completed since the
last ignition cycle.
The fault identified by the diagnostic test is currently
active.
The fault has been active during this ignition cycle.
The operating conditions at the time of the failure.
The Diagnostic Executive
The Diagnostic Executive is a unique segment of
software which is designed to coordinate and prioritize
the diagnostic procedures as well as define the protocol
for recording and displaying their results. The main
responsibilities of the Diagnostic Ex ecutive are listed as
follow s:
Commanding the check engine lamp on and off
DTC logging and clearing
Current status information on each diagnostic
Diagnostic Information
The diagnostic charts and functional checks are
designed to locate a faulty circuit or component through
a process of logical decisions. The charts are prepared
with the requirement that the vehicle functioned
correctly at the time of assembly and that there are not
multiple faults present.
There is a continuous self-diagnosis on certain control
functions. This diagnostic capability is complemented
by the diagnostic procedures contained in this manual.
The language of communicating the source of the
malfunction is a system of diagnostic trouble codes.
When a malfunction is detected by the control module, a
diagnostic trouble code is set and the check engine
lamp is illuminated.
Check Engine Lamp
The check engine lamp looks the same as the check
engine lamp you are already familiar with, the “Check
Engine” lamp.
Basically, the check engine lamp is turned on when the
Page 1459 of 4264
4JA1/4JH1 ENGINE DRIVEABILITY AND EMISSIONS 6E–87
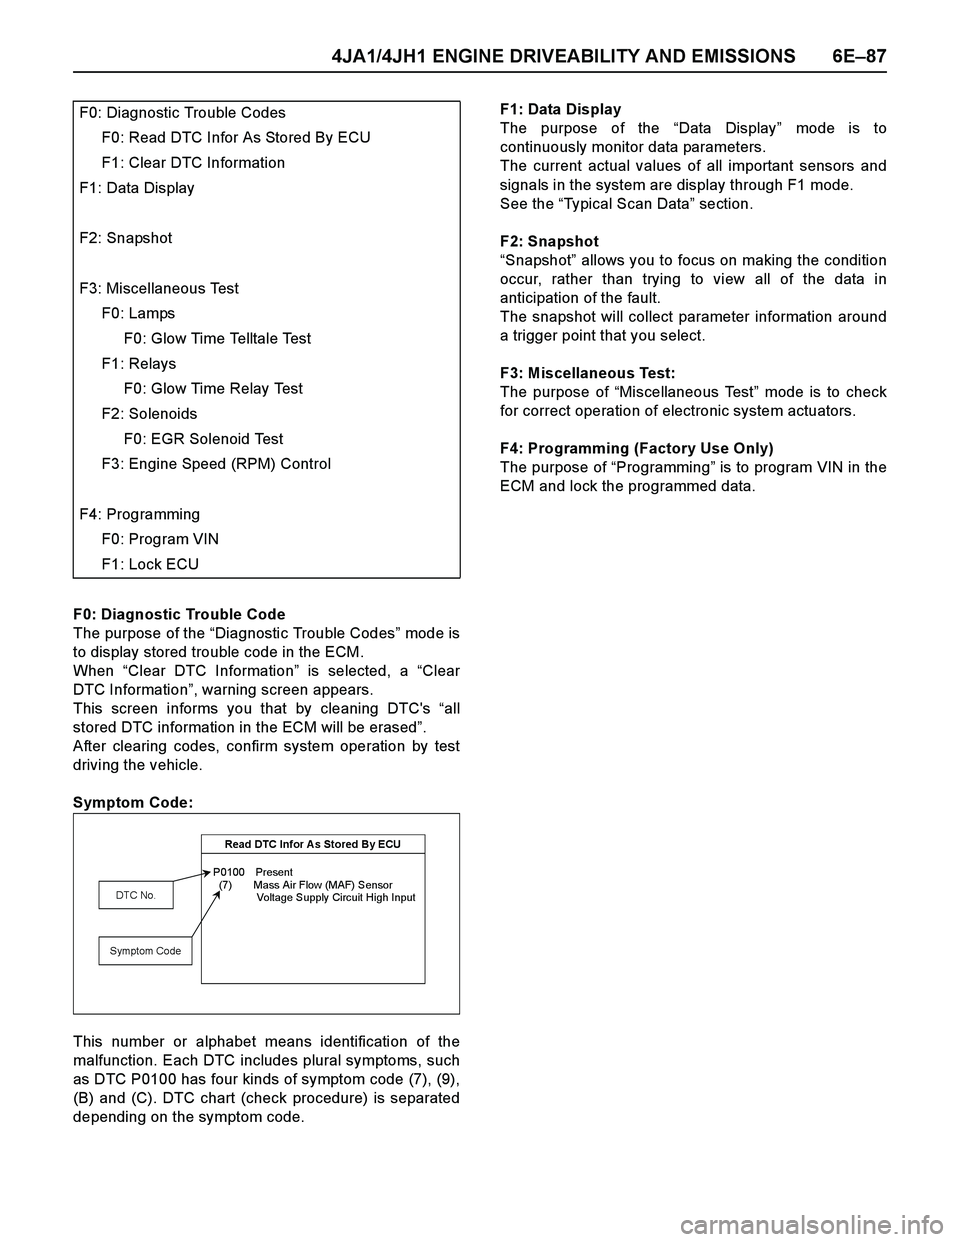
F0: Diagnostic Trouble Code
The purpose of the “Diagnostic Trouble Codes” mod e i s
to display stored trouble code in the ECM.
When “Clear DTC Information” is selected, a “Clear
DTC Information”, warning screen appears.
This screen informs you that by cleaning DTC's “all
stored DTC information in the ECM will be erased”.
After clearing codes, confirm system operation by test
driving the vehicle.
Symptom Code:
This number or alphabet means identification of the
malfunction. Each DTC includes plural symptoms, such
as DTC P0100 has four kinds of symptom code (7), (9),
(B) and (C). DTC chart (check procedure) is separated
depending on the symptom code.F1: Data Display
The purpose of the “Data Display” mode is to
continuously monitor data parameters.
The current actual values of all important sensors and
signals in the system are display through F1 mode.
See the “Typical Scan Data” section.
F2: Snapshot
“Snapshot” allows you to focus on making the condition
occur, rather than trying to view all of the data in
anticipation of the fault.
The snapshot will collect parameter information around
a trigger point that you select.
F3: Miscellaneous Test:
The purpose of “Miscellaneous Test” mode is to check
for correct operation of electronic system actuators.
F4: Programming (Factory Use Only)
The purpose of “Programming” is to program VIN in the
ECM and lock the programmed data. F0: Diagnostic Trouble Codes
F0: Read DTC Infor As Stored By ECU
F1: Clear DTC Information
F1: Data Display
F2: Snapshot
F3: Miscellaneous Test
F0: Lamps
F0: Glow Time Telltale Test
F1: Relays
F0: Glow Time Relay Test
F2: Solenoids
F0: EGR Solenoid Test
F3: Engine Speed (RPM) Control
F4: Programming
F0: Program VIN
F1: Lock ECU
Read DTC Infor A s Stored By ECU
P0100 Present
(7) Mass Air Flow (MAF) Sensor
Voltage Supply Circuit High Input
DTC No.
Symptom Code
Page 1460 of 4264
6E–88 4JA1/4JH1 ENGINE DRIVEABILITY AND EMISSIONS
TYPICAL SCAN DATA & DEFINITIONS (ENGINE DATA)
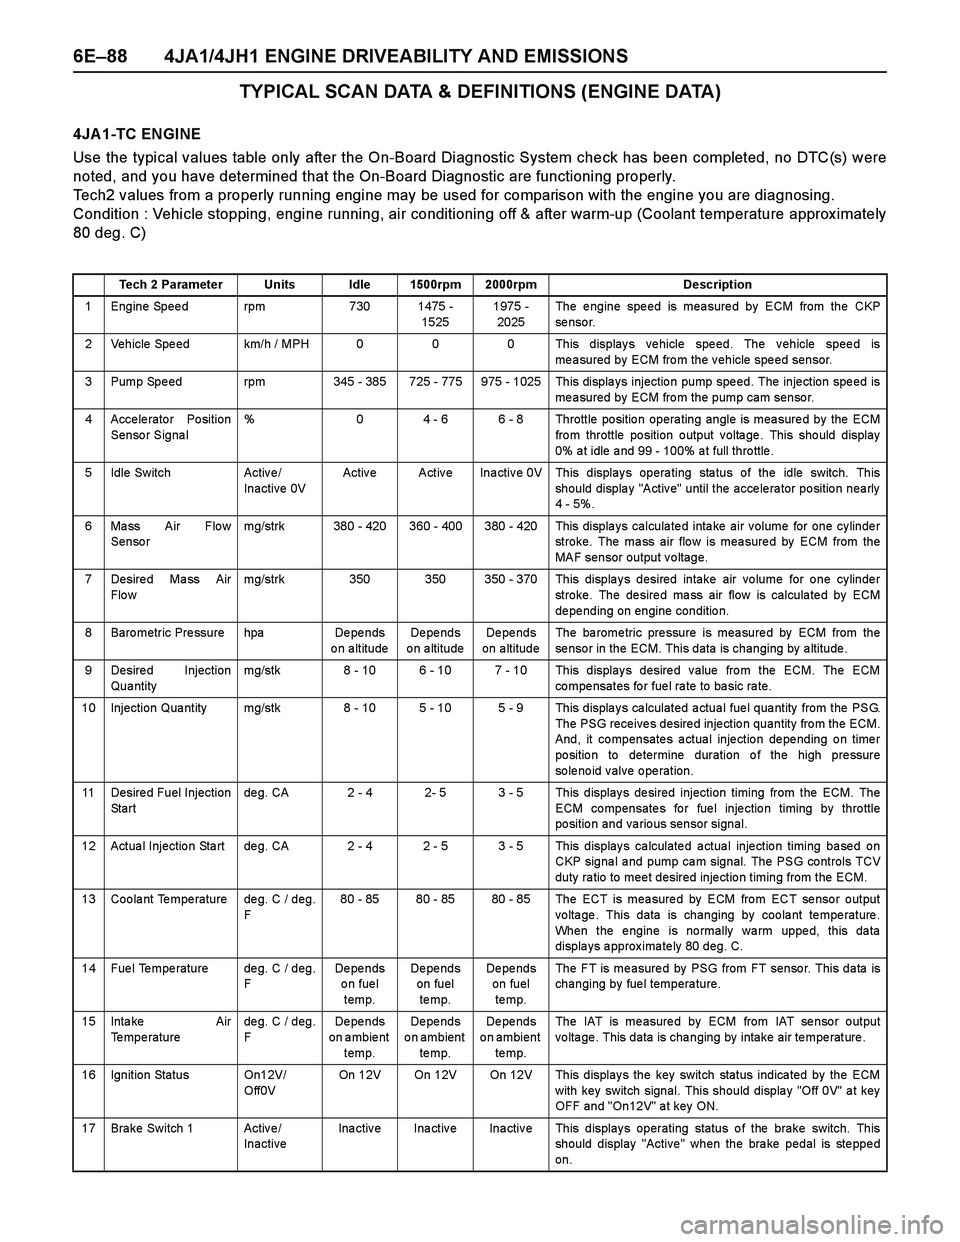
4JA 1-TC ENGINE
Use the typical values table only after the On-Board Diagnostic System check has been completed, no DTC(s) were
noted, and you have determined that the On-Board Diagnostic are functioning properly.
Tech2 values from a properly running engine may be used for comparison with the engine you are diagnosing.
Condition : Vehicle stopping, engine running, air conditioning off & after warm-up (Coolant temperature approx imately
80 deg. C)
Tech 2 Parameter Units Idle 1500rpm 2000rpm Description
1 Engine Speed rpm 730 1475 -
15251975 -
2025The engine speed is measured by ECM from the CKP
se nso r.
2 Vehicle Speed km/h / MPH 0 0 0 This displays vehicle speed. The vehicle speed is
measured by ECM from the vehicle speed sensor.
3 Pump Spe ed rpm 345 - 385 725 - 775 975 - 1025 This displa ys injectio n pump spe ed. The inje ction spe ed is
measured by ECM from the pump cam sensor.
4 Accelerator Position
Sensor Signal% 0 4 - 6 6 - 8 Throttle position operating angle is measured by the ECM
fro m throttle po sition o utput v olta ge . This sho uld display
0% a t idle a nd 99 - 100% a t full thro ttle .
5 Idle Switch Activ e /
Inactive 0VActive Active Inactive 0V This displays operating status of the idle switch. This
should display "Active" until the accelerator position nearly
4 - 5%.
6 Mass Air Flow
Sensormg/strk 380 - 420 360 - 400 380 - 420 This displays calculated intake air volume for one cylinder
stroke. The mass air flow is measured by ECM from the
MAF sensor output voltage.
7 Desire d Ma ss Air
Flo wmg/strk 350 350 350 - 370 This displays desired intake air volume for one cylinder
stroke. The desired mass air flow is calculated by ECM
de pe nding on engine conditio n.
8 Baro metric Pre ssure hpa De pe nds
on altitudeDe pe nds
o n a ltitudeDe pe nds
on altitudeThe ba rome tric pre ssure is mea sure d by ECM from the
sensor in the ECM. This data is changing by altitude.
9 Desired Injection
Qua ntitymg/stk 8 - 10 6 - 10 7 - 10 This displays desired value from the ECM. The ECM
co mpe nsates fo r fue l ra te to ba sic ra te.
10 Injection Qua ntity mg/stk 8 - 10 5 - 10 5 - 9 This displa y s ca lculated a ctua l fue l qua ntity from the PSG.
The PSG receives desired injection quantity from the ECM.
And, it compensates actual injection depending on timer
po sitio n to de termine duration o f the high pre ssure
solenoid valve operation.
11 Desire d Fuel Injection
St a r tde g. CA 2 - 4 2- 5 3 - 5 This display s de sired injection timing from the ECM. The
ECM compensates for fuel injection timing by throttle
position and various sensor signal.
12 Actua l Injectio n Sta rt de g. CA 2 - 4 2 - 5 3 - 5 This display s ca lculate d a ctua l inje ctio n timing ba se d o n
CKP signa l a nd pump ca m signal. The PSG controls TCV
duty ra tio to mee t desired inje ctio n timing from the ECM.
13 Coolant Temperature deg. C / deg.
F80 - 85 80 - 85 80 - 85 The ECT is measured by ECM from ECT sensor output
voltage. This data is changing by coolant temperature.
When the engine is normally warm upped, this data
displays approximately 80 deg. C.
14 Fuel Temperature deg. C / deg.
FDe pe nds
on fuel
temp.De pe nds
on fuel
te mp.De pe nds
on fuel
te mp.The FT is measured by PSG from FT sensor. This data is
changing by fuel temperature.
15 Inta ke Air
Temperaturedeg. C / deg.
FDe pe nds
on ambient
temp.De pe nds
on ambient
te mp.De pe nds
on ambient
te mp.The IAT is measured by ECM from IAT sensor output
voltage. This data is changing by intake air temperature.
16 Ignition Status On12V/
Off0VOn 12V On 12V On 12V This displays the key switch status indicated by the ECM
with key switch signal. This should display "Off 0V" at key
OFF and "On12V" at key ON.
17 Brake Switch 1 Active/
InactiveInactive Inactive Inactive This displays operating status of the brake switch. This
should display "Active" when the brake pedal is stepped
on.
Page 1462 of 4264
6E–90 4JA1/4JH1 ENGINE DRIVEABILITY AND EMISSIONS
TYPICAL SCAN DATA & DEFINITIONS (ENGINE DATA)
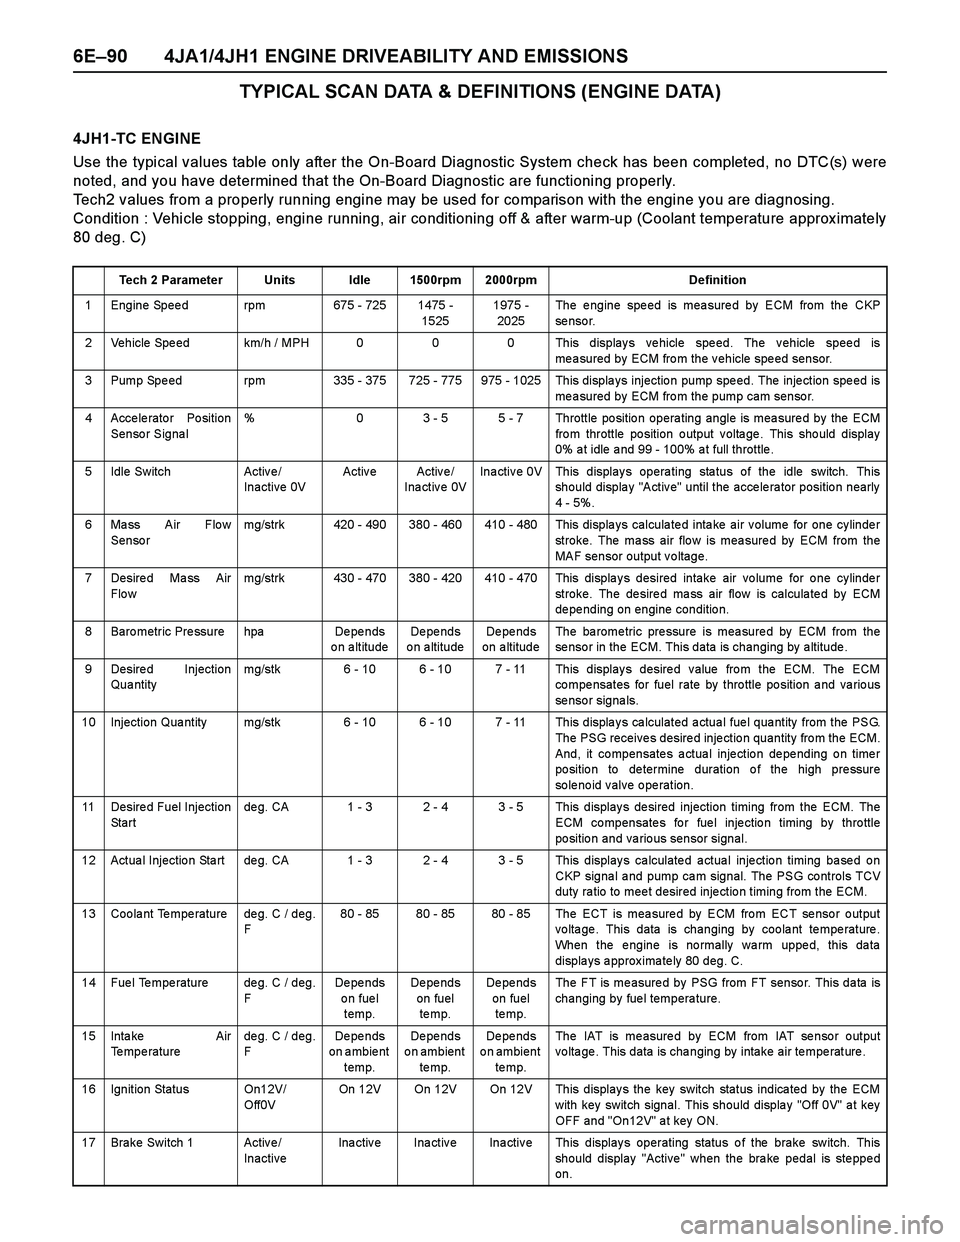
4JH1-TC ENGINE
Use the typical values table only after the On-Board Diagnostic System check has been completed, no DTC(s) were
noted, and you have determined that the On-Board Diagnostic are functioning properly.
Tech2 values from a properly running engine may be used for comparison with the engine you are diagnosing.
Condition : Vehicle stopping, engine running, air conditioning off & after warm-up (Coolant temperature approx imately
80 deg. C)
Tech 2 Parameter Units Idle 1500rpm 2000rpm Definition
1 Engine Speed rpm 675 - 725 1475 -
15251975 -
2025The engine speed is measured by ECM from the CKP
se nso r.
2 Vehicle Speed km/h / MPH 0 0 0 This displays vehicle speed. The vehicle speed is
measured by ECM from the vehicle speed sensor.
3 Pump Spe ed rpm 335 - 375 725 - 775 975 - 1025 This displa ys injectio n pump spe ed. The inje ction spe ed is
measured by ECM from the pump cam sensor.
4 Accelerator Position
Sensor Signal% 0 3 - 5 5 - 7 Throttle position operating angle is measured by the ECM
fro m throttle po sition o utput v olta ge . This sho uld display
0% a t idle a nd 99 - 100% a t full throttle .
5 Idle Switch Activ e /
Inactive 0VActive Active/
Inactive 0VInactive 0V This displays operating status of the idle switch. This
should display "Active" until the accelerator position nearly
4 - 5%.
6 Mass Air Flow
Sensormg/strk 420 - 490 380 - 460 410 - 480 This displays calculated intake air volume for one cylinder
stroke. The mass air flow is measured by ECM from the
MAF sensor output voltage.
7 Desire d Ma ss Air
Flo wmg/strk 430 - 470 380 - 420 410 - 470 This displays desired intake air volume for one cylinder
stroke. The desired mass air flow is calculated by ECM
de pe nding on engine conditio n.
8 Baro metric Pre ssure hpa De pe nds
on altitudeDe pe nds
o n a ltitudeDe pe nds
on altitudeThe ba rome tric pre ssure is mea sure d by ECM from the
sensor in the ECM. This data is changing by altitude.
9 Desired Injection
Qua ntitymg/stk 6 - 10 6 - 10 7 - 11 This displays desired value from the ECM. The ECM
co mpe nsates for fuel rate by thro ttle po sition a nd va rio us
se nso r signa ls.
10 Injection Qua ntity mg/stk 6 - 10 6 - 10 7 - 11 This displa y s ca lculated a ctua l fue l qua ntity from the PSG.
The PSG receives desired injection quantity from the ECM.
And, it compensates actual injection depending on timer
po sitio n to de termine duration o f the high pre ssure
solenoid valve operation.
11 Desire d Fuel Injection
St a r tde g. CA 1 - 3 2 - 4 3 - 5 This display s de sired injection timing from the ECM. The
ECM compensates for fuel injection timing by throttle
position and various sensor signal.
12 Actua l Injectio n Sta rt de g. CA 1 - 3 2 - 4 3 - 5 This display s ca lculate d a ctua l inje ctio n timing ba se d o n
CKP signa l a nd pump ca m signal. The PSG controls TCV
duty ra tio to mee t desired inje ctio n timing from the ECM.
13 Coolant Temperature deg. C / deg.
F80 - 85 80 - 85 80 - 85 The ECT is measured by ECM from ECT sensor output
voltage. This data is changing by coolant temperature.
When the engine is normally warm upped, this data
displays approximately 80 deg. C.
14 Fuel Temperature deg. C / deg.
FDe pe nds
on fuel
temp.De pe nds
on fuel
te mp.De pe nds
on fuel
te mp.The FT is measured by PSG from FT sensor. This data is
changing by fuel temperature.
15 Inta ke Air
Temperaturedeg. C / deg.
FDe pe nds
on ambient
temp.De pe nds
on ambient
te mp.De pe nds
on ambient
te mp.The IAT is measured by ECM from IAT sensor output
voltage. This data is changing by intake air temperature.
16 Ignition Status On12V/
Off0VOn 12V On 12V On 12V This displays the key switch status indicated by the ECM
with key switch signal. This should display "Off 0V" at key
OFF and "On12V" at key ON.
17 Brake Switch 1 Active/
InactiveInactive Inactive Inactive This displays operating status of the brake switch. This
should display "Active" when the brake pedal is stepped
on.