Page 4000 of 4264

7A2-8 DIAGNOSIS (JR405E)
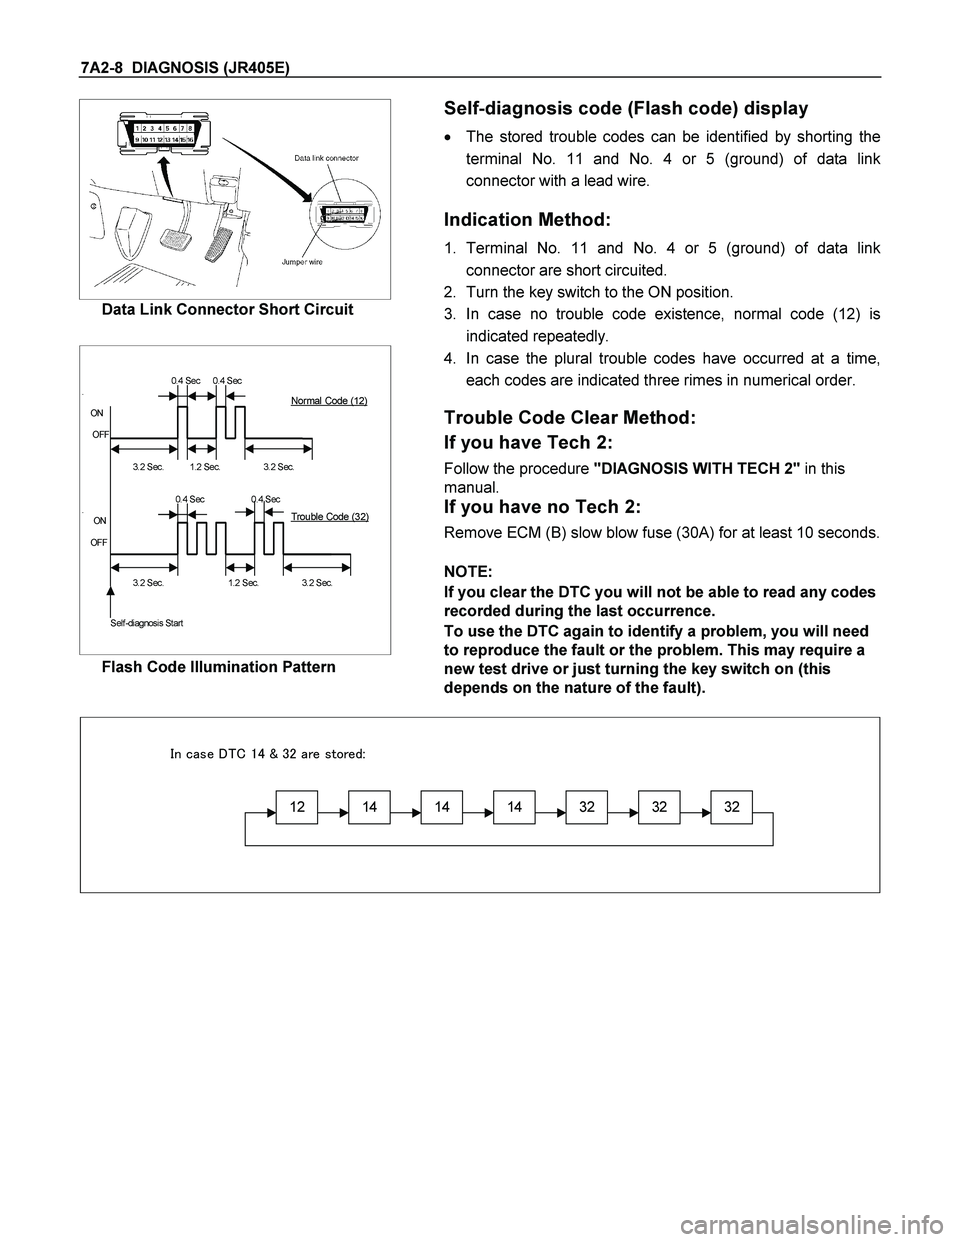
Data Link Connector Short Circuit
Self-diagnosis code (Flash code) display
� The stored trouble codes can be identified by shorting the
terminal No. 11 and No. 4 or 5 (ground) of data link
connector with a lead wire.
Indication Method:
1. Terminal No. 11 and No. 4 or 5 (ground) of data link
connector are short circuited.
2. Turn the key switch to the ON position.
3. In case no trouble code existence, normal code (12) is
indicated repeatedly.
�������
0.4 Sec 0.4 Sec
.
ON
OFF
��
3.2 Sec.��
1.2 Sec.����
3.2 Sec.
0.4 Sec 0.4 Sec
.
ON
OFF
3.2 Sec.��
1.2 Sec.�
��
3.2 Sec.
Self -diagnosis Start
Normal Code (12)
Troubl e Code (32)
Flash Code Illumination Pattern
4. In case the plural trouble codes have occurred at a time,
each codes are indicated three rimes in numerical order.
Trouble Code Clear Method:
If you have Tech 2:
Follow the procedure "DIAGNOSIS WITH TECH 2" in this
manual.
If you have no Tech 2:
Remove ECM (B) slow blow fuse (30A) for at least 10 seconds.
NOTE:
If you clear the DTC you will not be able to read any codes
recorded during the last occurrence.
To use the DTC again to identify a problem, you will need
to reproduce the fault or the problem. This may require a
new test drive or just turning the key switch on (this
depends on the nature of the fault).
12141414323232
���������
����
���������������
Page 4001 of 4264

DIAGNOSIS (JR405E) 7A2-9
DIAGNOSIS WITH TECH 2
In this JR405E transmission, troubleshooting can be performed for electrical faults using the Tech 2 scan tool.
If the "CHECK TRANS" lamp blinks, or if an electrical fault in the transmission may probably exit, check trouble
codes using the Tech 2 scan tool.
In the diagnostic procedures described in this manual, first repair the faulty positions indicated by trouble code in
order of numbers and then perform troubleshooting for the faulty positions that are not indicated by trouble code.
For correct troubleshooting, it is necessary to first repair the trouble codes of lower order numbers, then to repair
the trouble codes of higher order numbers in sequence.
If no codes are set:
� Refer to F1: Data Display and identify the electrical faults that are not indicated by trouble code.
� Refer to "SYMPTOM DIAGNOSIS".
If codes are set:
1. Record all trouble codes displayed by Tech 2 and check id the codes are intermittent.
2. Clear the codes.
3. Drive the vehicle for a test to reproduce the faulty status.
4. Check trouble codes again using the Tech 2.
5. If no codes is displayed by test driving, the fault is intermittent. In this case, refer to "INTERMITTENT
DIAGNOSIS".
6. If a code is present, refer to DTC Chart for diagnosis.
7. Check trouble codes again using the Tech 2.
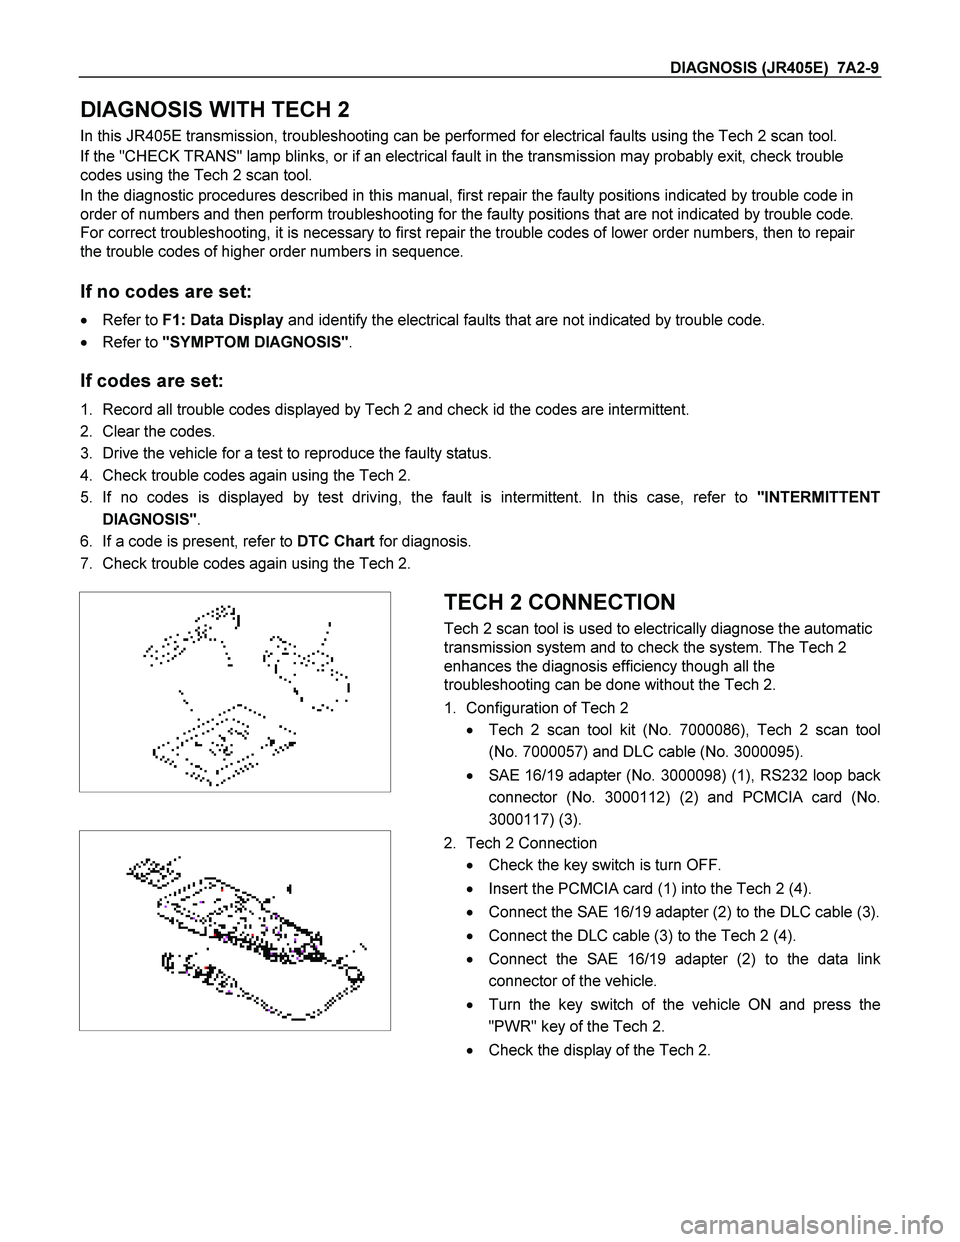
TECH 2 CONNECTION
Tech 2 scan tool is used to electrically diagnose the automatic
transmission system and to check the system. The Tech 2
enhances the diagnosis efficiency though all the
troubleshooting can be done without the Tech 2.
1. Configuration of Tech 2
� Tech 2 scan tool kit (No. 7000086), Tech 2 scan tool
(No. 7000057) and DLC cable (No. 3000095).
� SAE 16/19 adapter (No. 3000098) (1), RS232 loop back
connector (No. 3000112) (2) and PCMCIA card (No.
3000117) (3).
2. Tech 2 Connection
� Check the key switch is turn OFF.
� Insert the PCMCIA card (1) into the Tech 2 (4).
� Connect the SAE 16/19 adapter (2) to the DLC cable (3).
� Connect the DLC cable (3) to the Tech 2 (4).
� Connect the SAE 16/19 adapter (2) to the data link
connector of the vehicle.
� Turn the key switch of the vehicle ON and press the
"PWR" key of the Tech 2.
� Check the display of the Tech 2.
Page 4004 of 4264

7A2-12 DIAGNOSIS (JR405E)
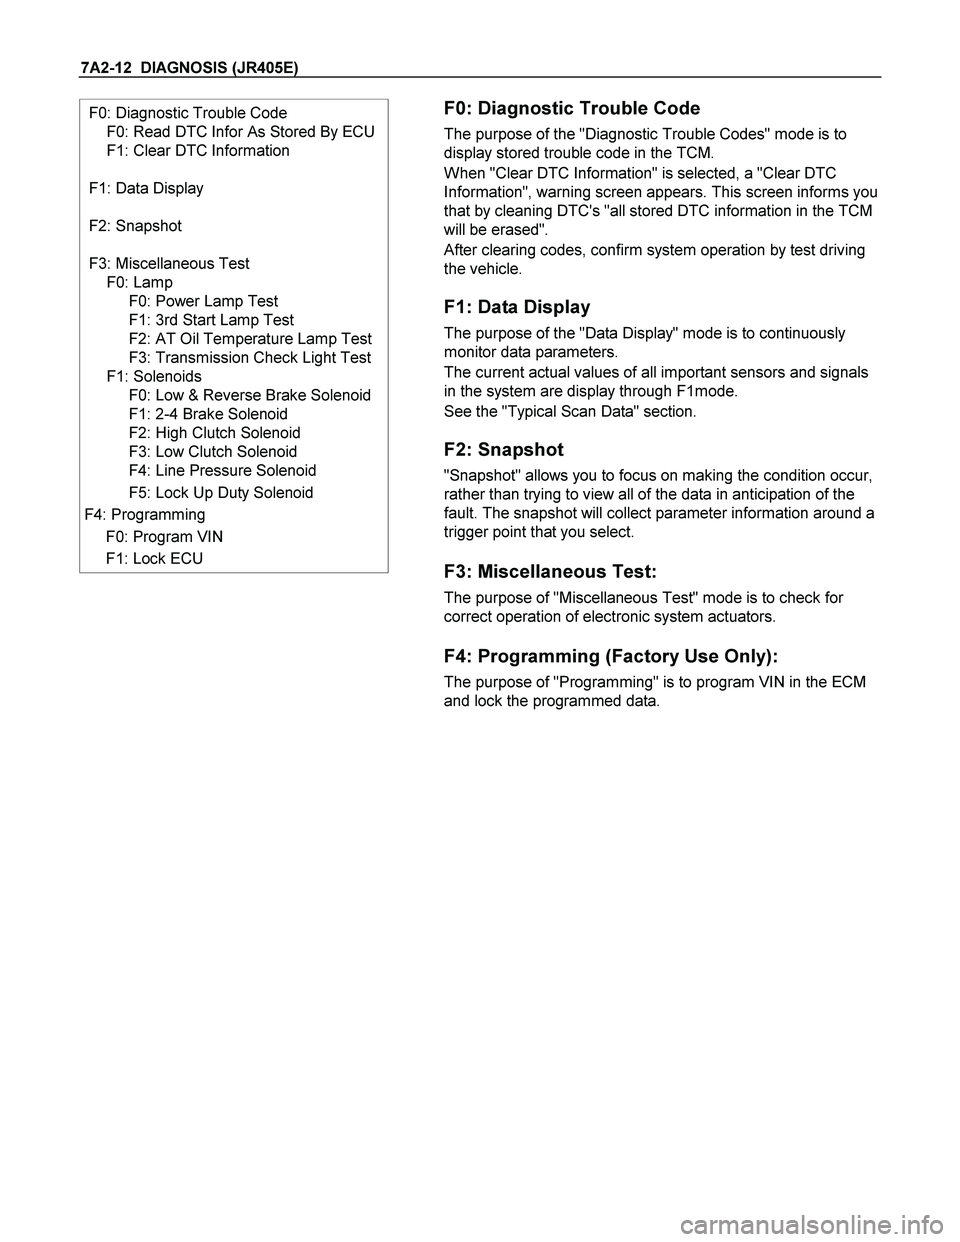
F0: Diagnostic Trouble Code
F0: Read DTC Infor As Stored By ECU
F1: Clear DTC Information
F1: Data Display
F2: Snapshot
F3: Miscellaneous Test
F0: Lamp
F0: Power Lamp Test
F1: 3rd Start Lamp Test
F2: AT Oil Temperature Lamp Test
F3: Transmission Check Light Test
F1: Solenoids
F0: Low & Reverse Brake Solenoid
F1: 2-4 Brake Solenoid
F2: High Clutch Solenoid
F3: Low Clutch Solenoid
F4: Line Pressure Solenoid
F5: Lock Up Duty Solenoid
F4: Programming
F0: Program VIN
F1: Lock ECU
F0: Diagnostic Trouble Code
The purpose of the "Diagnostic Trouble Codes" mode is to
display stored trouble code in the TCM.
When "Clear DTC Information" is selected, a "Clear DTC
Information", warning screen appears. This screen informs you
that by cleaning DTC's "all stored DTC information in the TCM
will be erased".
After clearing codes, confirm system operation by test driving
the vehicle.
F1: Data Display
The purpose of the "Data Display" mode is to continuously
monitor data parameters.
The current actual values of all important sensors and signals
in the system are display through F1mode.
See the "Typical Scan Data" section.
F2: Snapshot
"Snapshot" allows you to focus on making the condition occur,
rather than trying to view all of the data in anticipation of the
fault. The snapshot will collect parameter information around a
trigger point that you select.
F3: Miscellaneous Test:
The purpose of "Miscellaneous Test" mode is to check for
correct operation of electronic system actuators.
F4: Programming (Factory Use Only):
The purpose of "Programming" is to program VIN in the ECM
and lock the programmed data.
Page 4008 of 4264

7A2-16 DIAGNOSIS (JR405E)
INTERMITTENT DIAGNOSIS
If the Tech 2 displays any codes as intermittent, or if after a test drive any codes does not reappear, the problem is
most likely a faulty electrical connection or loose wiring.
Terminals should always be the prime suspect.
Intermittent rarely occur in sophisticated electronic components such as the TCM.
When an intermittent problem is encountered, check suspect circuits for:
� Poor terminal to wire connection.
� Terminals not fully seated in the connector body.
� Improperly formed or damaged terminals.
� Loose, dirty or damaged terminals.
Any time you have an intermittent in more than one circuit, check whether the circuits share a common ground
connection.
� Pinched or damaged wires.
� Electric interference.
Check for improperly installed electrical options, such as light, radios, etc.
Use the F2: Snapshot mode of the Tech 2 to help isolate the cause of an intermittent fault. The snapshot mode will
record information before and after the problem occurs. Set the snapshot to "Trigger" on the suspected code or, if
you notice the reported symptom during test drive, trigger the snapshot manually.
After the snapshot has been triggered, command the Tech 2 to play back the flow of data recorded from each of the
various sensors. Sings of intermittent fault in a sensor circuit are a sudden unexplainable jump in data values out of
the normal range.
Page 4009 of 4264
![ISUZU TF SERIES 2004 Workshop Manual DIAGNOSIS (JR405E) 7A2-17
SNAPSHOT DISPLAY WITH TIS2000 (For Snapshot Data Analysis)
Procedures for transferring and displaying Tech2 snapshot data by using TIS2000 [Snapshot Upload] function is ISUZU TF SERIES 2004 Workshop Manual DIAGNOSIS (JR405E) 7A2-17
SNAPSHOT DISPLAY WITH TIS2000 (For Snapshot Data Analysis)
Procedures for transferring and displaying Tech2 snapshot data by using TIS2000 [Snapshot Upload] function is](/manual-img/61/57180/w960_57180-4008.png)
DIAGNOSIS (JR405E) 7A2-17
SNAPSHOT DISPLAY WITH TIS2000 (For Snapshot Data Analysis)
Procedures for transferring and displaying Tech2 snapshot data by using TIS2000 [Snapshot Upload] function is
described below.
Snapshot data can be displayed with [Snapshot Upload] function included in TIS2000.
By analyzing these data in various methods, trouble conditions can be checked.
Snapshot data is displayed by executing the three steps below shown:
1. Record the snapshot data, in Tech2.
2. Transfer the snapshot data to PC.
After recording the snapshot in Tech2, transfer the data from Tech2 to PC by the below procedures.
1. Start TIS2000.
2. Select [Snapshot Upload] on the TIS2000 start screen.
3. Select [Upload from trouble diagnosis tool (transfer from diagnosis tester)] or click the corresponding icon of
the tool bar.
4. Select Tech2, and transfer the recorded snapshot information.
5. Select the transferred snapshot.
6. After ending transfer of the snapshot, data parameter list is displayed on the screen.
Page 4010 of 4264
![ISUZU TF SERIES 2004 Workshop Manual 7A2-18 DIAGNOSIS (JR405E)
3. Snapshot data is displayed with TIS2000 [Snapshot Upload] function.
Snapshot is stored in the PC hard disk or floppy disk, and can be displayed any time.
Stored ISUZU TF SERIES 2004 Workshop Manual 7A2-18 DIAGNOSIS (JR405E)
3. Snapshot data is displayed with TIS2000 [Snapshot Upload] function.
Snapshot is stored in the PC hard disk or floppy disk, and can be displayed any time.
Stored](/manual-img/61/57180/w960_57180-4009.png)
7A2-18 DIAGNOSIS (JR405E)
3. Snapshot data is displayed with TIS2000 [Snapshot Upload] function.
Snapshot is stored in the PC hard disk or floppy disk, and can be displayed any time.
Stored snapshot can be displayed by the below procedures.
1. Start TIS2000.
2. Select [Snapshot Upload] on the TIS2000 start screen.
3. Select [Open the existing files] or click the corresponding icon of the tool bar.
4. Select the transferred snapshot.
5. Open the snapshot, to display the data parameter list on the screen.
Graph display
Values and graphs (Max. 3 graphs):
1. Click the icon for graph display. [Graph Parameter] window opens.
2. Click the first graph icon of the window upper part, and select one parameter from the list of the window lower
part. Selected parameter is displayed nest to the graph icon. Graph division can be selected in the field on the
parameter right side.
3. Repeat the same procedures with the 2nd and 3rd icons.
4. After selecting all parameters to be displayed (Max. 3 parameters), click [OK] button.
Page 4011 of 4264
DIAGNOSIS (JR405E) 7A2-19
5. Parameter selected is displayed in graph form on the right of the data parameter on the screen.
6. Graph display can be moved with the navigation icon.
7. For displaying another parameter by graph, click the parameter of the list, drug the mouse to the display screen
while pressing the mouse button and release the mouse button. New parameter is displayed at the position of
the previous parameter. For displaying the graph display screen in full size, move the cursor upward on the
screen. When the cursor is changed to the magnifying glass form, click the screen. Graph screen is displayed
on the whole screen.
Page 4012 of 4264
7A2-20 DIAGNOSIS (JR405E)
Display of graphs on one screen (Max. 6 graphs):
1. Click the 6 graph icon. [Graph Parameter] window opens.
2. Click the graph icon, select the parameter to be displayed from the list and change divisions according to
necessity.
3. Repeat the same procedures with the graph icons, from the 2nd to 6th.
4. Click the [OK] button to display.
5. In this case, parameters are displayed only in graph form. All parameters are displayed in one graph.
6. The graph display screen can be moved with the navigation icon.