2004 ISUZU TF SERIES air condition
[x] Cancel search: air conditionPage 2639 of 4264
ENGINE DRIVEABILITY AND EMISSIONS 6E–63
3. Check Bulletins and
Troubleshooting Hints
NOTE: As estimated 30 percent of successful vehicle
repairs are diagnosed with this step!
What you should do
You should have enough information gained from
preliminary checks to accurately search for a bulletin
and other related service information. Some service
manual sections provide troubleshooting hints that
match symptoms with specific complaints.
What resources you should use
You should use the following resources for assistance in
checking for bulletins and troubleshooting hints:
Printed bulletins
Access ISUZU Bulletin Web site.
Videotapes
Service manual
4. Perform Service Manual
Diagnostic Checks
What you should do
The “System Checks” in most service manual sections
and in most cells of section 8A (electrical) provide you
with:
A systematic approach to narrowing down the
possible causes of a system fault
Direction to specific diagnostic procedures in the
service manual
Assistance to identify what systems work correctly
What resources you should use
Whenever possible, you should use the following
resources to perform service manual checks:
Service manual
Technical equipment (for viewing DTCs and
analyzing data)
Digital multimeter and circuit testing tools
Other tools as needed
5a and 5b. Perform Service Manual
Diagnostic Procedures
NOTE: An estimated 40 percent of successful vehicle
repairs are diagnosed with these steps!
What you should do
When directed by service manual diagnostic checks,
you must then carefully and accurately perform the
steps of diagnostic procedures to locate the fault relatedto the customer complaint.
What resources you should use
Whenever appropriate, you should use the following
resources to perform service manual diagnostic
procedures:
Service manual
Technical equipment (for analyzing diagnostic data)
Digital multimeter and circuit testing tools
Essential and special tools
5c. Technician Self Diagnoses
When there is no DTC stored and no matching
symptom for the condition identified in the service
manual, you must begin with a thorough understanding
of how the system(s) operates. Efficient use of the
service manual combined with you ex perience and a
good process of elimination will result in accurate
diagnosis of the condition.
What you should do
Step 1: Identify and understand the suspect
circuit(s)
Having completed steps 1 through 4 of the Strategy
Based Diagnostics chart, you should have enough
information to identify the system(s) or sub-system(s)
involved. Using the service manual, you should
determine and investigate the following circuit
characteristics:
Electrical:
–How is the circuit powered (power distribution
charts and/or fuse block details)?
–How is the circuit grounded (ground distribution
charts)?
–How is the circuit controlled or sensed (theory of
operation):
–If it is a switched circuit, is it normally open or
normally closed?
–Is the power switched or is the ground
switched?
–Is it a variable resistance circuit (ECT sensor
or TP sensor, for ex ample)?
–Is it a signal generating device (MAF sensor of
VSS, for example)?
–Does it rely on some mechanical/vacuum
device to operate?
Physical:
–Where are the circuit components (component
locators and wire harness routing diagrams):
–Are there areas where wires could be chafed
or pinched (brackets or frames)?
–Are there areas subjected to ex treme
temperatures?
Page 2640 of 4264
6E–64 ENGINE DRIVEABILITY AND EMISSIONS
–Are there areas subjected to vibration or
movement (engine, transmission or
suspension)?
–Are there areas ex posed to moisture, road salt
or other corrosives (battery acid, oil or other
fluids)?
–Are there common mounting areas with other
systems/components?
–Have previous repairs been performed to wiring,
connectors, components or mounting areas
(causing pinched wires between panels and
drivetrain or suspension components without
causing and immediate problem)?
–Does the vehicle have aftermarket or dealer-
installed equipment (radios, telephone, etc.)
Step 2: Isolate the problem
At this point, you should have a good idea of what could
cause the present condition, as well as could not cause
the condition. Actions to take include the following:
Divide (and separate, where possible) the system or
circuit into smaller sections
Confine the problem to a smaller area of the vehicle
(start with main harness connections while removing
panels and trim as necessary in order to eliminate
large vehicle sections from further investigation)
For two or more circuits that do not share a common
power or ground, concentrate on areas where
harnesses are routed together or connectors are
shared (refer to the following hints)
Hints
Though the symptoms may vary, basic electrical failures
are generally caused by:
Loose connections:
–Open/high resistance in terminals, splices,
connectors or grounds
Incorrect connector/harness routing (usually in new
vehicles or after a repair has been made):
–Open/high resistance in terminals, splices,
connectors of grounds
Corrosion and wire damage:
–Open/high resistance in terminals, splices,
connectors of grounds
Component failure:
–Opens/short and high resistance in relays,
modules, switches or loads
Aftermarket equipment affecting normal operation of
other systems
You may isolate circuits by:
Unplugging connectors or removing a fuse to
separate one part of the circuit from another part
Operating shared circuits and eliminating those that
function normally from the suspect circuit
If only one component fails to operate, begin testingat the component
If a number of components do no operate, begin tests
at the area of commonality (such as power sources,
ground circuits, switches or major connectors)
What resources you should use
Whenever appropriate, you should use the following
resources to assist in the diagnostic process:
Service manual
Technical equipment (for data analysis)
Ex perience
Technical Assistance
Circuit testing tools
5d. Intermittent Diagnosis
By definition, an intermittent problem is one that does
not occur continuously and will occur when certain
conditions are met. All these conditions, however, may
not be obvious or currently known. Generally,
intermittents are caused by:
Faulty electrical connections and wiring
Malfunctioning components (such as sticking relays,
solenoids, etc.)
EMI/RFI (Electromagnetic/radio frequency
interference)
Aftermarket equipment
Intermittent diagnosis requires careful analysis of
suspected systems to help prevent replacing good
parts. This may involve using creativity and ingenuity to
interpret customer complaints and simulating all
ex ternal and internal system conditions to duplicate the
problem.
What you should do
Step 1: A cquire information
A thorough and comprehensive customer check sheet
is critical to intermittent problem diagnosis. You should
require this, since it will dictate the diagnostic starting
point. The vehicle service history file is another
source for accumulating information about the
complaint.
Step 2: A nalyze the intermittent problem
Analyze the customer check sheet and service history
file to determine conditions relevant to the suspect
system(s).
Using service manual information, you must identify,
trace and locate all electrical circuits related to the
malfunctioning system(s). If there is more than one
system failure, you should identify, trace and locate
areas of commonality shared by the suspect circuits.
Page 2641 of 4264
ENGINE DRIVEABILITY AND EMISSIONS 6E–65
Step 3: Simulate the symptom and isolate the
problem
Simulate the symptom and isolate the system by
reproducing all possible conditions suggested in Step 1
while monitoring suspected circuits/components/
systems to isolate the problem symptom. Begin with the
most logical circuit/component.
Isolate the circuit by dividing the suspect system into
simpler circuits. Nex t, confine the problem into a smaller
area of the system. Begin at the most logical point (or
point of easiest access) and thoroughly check the
isolated circuit for the fault, using basic circuit tests.
Hints
You can isolate a circuit by:
Unplugging connectors or removing a fuse to
separate one part of the circuit from another
If only component fails to operate, begin testing the
component
If a number of components do not operate, begin test
at areas of commonality (such as power sources,
ground circuits, switches, main connectors or major
components)
Substitute a known good part from the parts
department or the vehicle system
Try the suspect part in a known good vehicle
See Symptom Simulation Tests on the nex t page for
problem simulation procedures. Refer to service manual
sections 6E and 8A for information about intermittent
diagnosis. Follow procedures for basic circuit testing in
service manual section 8A.
What resources you should use
Whenever appropriate, you should use the following
resources to assist in the diagnostic process:
Service manual
Bulletins
Digital multimeter (with a MIN/MAX feature)
Tech II and Tech II upload function
Circuit testing tools (including connector kits/
harnesses and jumper wires)
Ex perience
Intermittent problem solving simulation methods
Customer complaint check sheet
Symptom Simulation Tests
1. Vibration
This method is useful when the customer complaint
analysis indicates that the problem occurs when the
vehicle/system undergoes some form of vibration.
For connectors and wire harness, slightly shake
vertically and horizontally. Inspect the connector joint
and body for damage. Also, tapping lightly along a
suspected circuit may be helpful.For parts and sensors, apply slight vibration to the part
with a light tap of the finger while monitoring the system
for a malfunction.
2. Heat
This method is important when the complaint suggests
that the problem occurs in a heated environment. Apply
moderate heat to the component with a hair drier or
similar tool while monitoring the system for a
malfunction.
CA UTION: Care must be take to avoid overheating
the component.
3. Water and Moisture
This method may be used when the complaint suggests
that the malfunction occurs on a rainy day or under
conditions of high humidity. In this case, apply water in a
light spray on the vehicle to duplicate the problem.
CA UTION: Care must be take to avoid directly
exposing electrical connections to water.
4. Electrical loads
This method involves turning systems ON (such as the
blower, lights or rear window defogger) to create a load
on the vehicle electrical system at the same time you
are monitoring the suspect circuit/component.
5e. Vehicle Operates as Designed
This condition refers to instances where a system
operating as designed is perceived to be unsatisfactory
or undesirable. In general, this is due to:
A lack of understanding by the customer
A conflict between customer ex pectations and
vehicle design intent
A system performance that is unacceptable to the
customer
What you should do
You can verify that a system is operating as designed
by:
Reviewing service manual functional/diagnostic
checks
Ex amining bulletins and other service information for
supplementary information
Compare system operation to an identical vehicle
If the condition is due to a customer misunderstanding
or a conflict between customer ex pectation and system
operation, you should ex plain the system operation to
the customer.
If the complaint is due to a case of unsatisfactory
system performance, you should contact Technical
Assistance for the latest information.
What resources you should use
Whenever possible, you should use the following
resources to facilitate the diagnostic process:
Page 2642 of 4264
6E–66 ENGINE DRIVEABILITY AND EMISSIONS
Vehicle service information (service manual, etc.)
ISUZU field support
Ex perience
Identical vehicle or system for comparison
6. Re-examine the complaint
When you do not successfully find/isolate the problem
after ex ecuting a diagnostic path, you should re-
ex amine the complaint.
What you should do
In this case, you will need to backtrack and review
information accumulated from step 1 through 4 of
Strategy Based Diagnostics. You also should repeat any
procedures that require additional attention.
A previous path may be eliminated from consideration
only if you are certain that all steps were ex ecuted as
directed. You must then select another diagnostic path
(step 5a, 5b, 5c or 5d). If all possible options have been
ex plored, you may call or seek ISUZU field support.
What resources you should use
Whenever possible, you should use the following
resources to facilitate the diagnostic process:
Service manual
Accumulated information form a previous diagnostic
path
Service information and publications
ISUZU field support
7. Repair and Verify Fix
What you should do
After you have located the cause of the problem, you
must ex ecute a repair by following recommended
service manual procedures.
When the repair is completed, you should verify the fix
by performing the system checks under the conditions
listed in the customer complaint.
If applicable, you should carry out preventive measures
to avoid a repeat complaint.
What resources you should use
Whenever possible, you should use the following
resources to facilitate the repair process:
Electrical repair procedures
Service manual information and publications
Page 2644 of 4264
6E–68 ENGINE DRIVEABILITY AND EMISSIONS
On-Board Diagnostic (OBD)
On-Board Diagnostic Tests
A diagnostic test is a series of steps, the result of which
is a pass or fail reported to the diagnostic ex ecutive.
When a diagnostic test reports a pass result, the
diagnostic ex ecutive records the following data:
The diagnostic test has been completed since the
last ignition cycle.
The diagnostic test has passed during the current
ignition cycle.
The fault identified by the diagnostic test is not
currently active.
When a diagnostic test reports a fail result, the
diagnostic ex ecutive records the following data:
The diagnostic test has been completed since the
last ignition cycle.
The fault identified by the diagnostic test is currently
active.
The fault has been active during this ignition cycle.
The operating conditions at the time of the failure.
The Diagnostic Executive
The Diagnostic Executive is a unique segment of
software which is designed to coordinate and prioritize
the diagnostic procedures as well as define the protocol
for recording and displaying their results. The main
responsibilities of the Diagnostic Ex ecutive are listed as
follows:
Commanding the check engine lamp on and off
DTC logging and clearing
Current status information on each diagnostic
Diagnostic Information
The diagnostic charts and functional checks are
designed to locate a faulty circuit or component through
a process of logical decisions. The charts are prepared
with the requirement that the vehicle functioned
correctly at the time of assembly and that there are not
multiple faults present.
There is a continuous self-diagnosis on certain control
functions. This diagnostic capability is complemented
by the diagnostic procedures contained in this manual.
The language of communicating the source of the
malfunction is a system of diagnostic trouble codes.
When a malfunction is detected by the control module, a
diagnostic trouble code is set and the check engine
lamp is illumi nated.
Check Engine Lamp
The check engine lamp looks the same as the check
engine lamp you are already familiar with, the “Check
Engine” lamp.
Basically, the check engine lamp is turned on when the
ECM detects a DTC that will impact the vehicle
emissions.
When the check engine lamp remains “ON” while the
engine is running, or when a malfunction issuspected due to a driveability or emissions problem,
a Powertrain On-Board Diagnostic (OBD) System
Check must be performed. The procedures for these
checks are given in On-Board Diagnostic (OBD)
System Check. These checks will ex pose faults
which may not be detected if other diagnostics are
performed first.
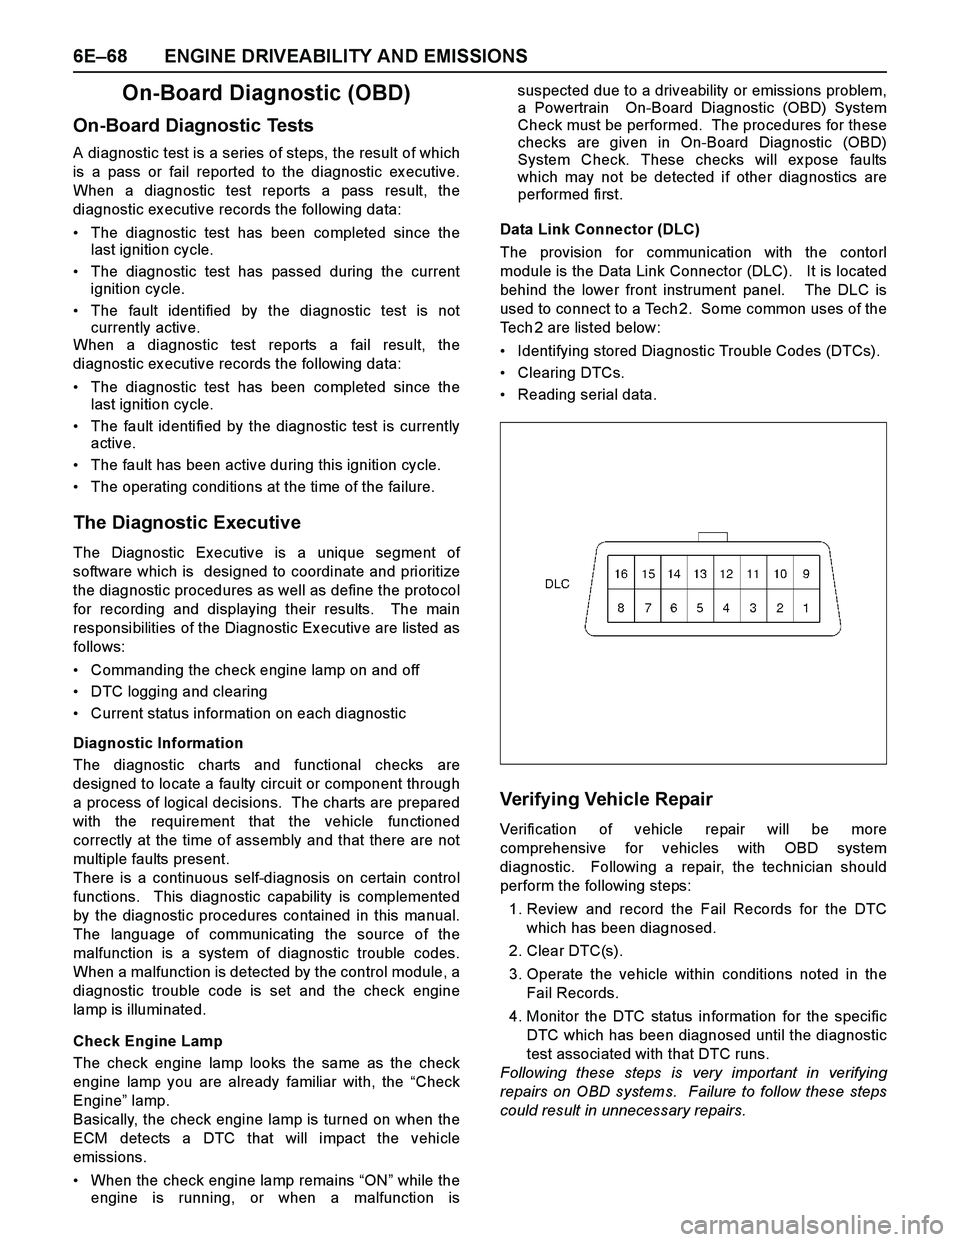
Data Link Connector (DLC)
The provision for communication with the contorl
module is the Data Link Connector (DLC). It is located
behind the lower front instrument panel. The DLC is
used to connect to a Tech 2. Some common uses of the
Tech 2 are listed below:
Identifying stored Diagnostic Trouble Codes (DTCs).
Clearing DTCs.
Reading serial data.
Ver ify in g Veh icle Repair
Verification of vehicle repair will be more
comprehensive for vehicles with OBD system
diagnostic. Following a repair, the technician should
perform the following steps:
1. Review and record the Fail Records for the DTC
which has been diagnosed.
2. Clear DTC(s).
3. Operate the vehicle within conditions noted in the
Fail Records.
4. Monitor the DTC status information for the specific
DTC which has been diagnosed until the diagnostic
test associated with that DTC runs.
Following these steps is very important in verifying
repairs on OBD systems. Failure to follow these steps
could result in unnecessary repairs.
Page 2648 of 4264
6E–72 ENGINE DRIVEABILITY AND EMISSIONS
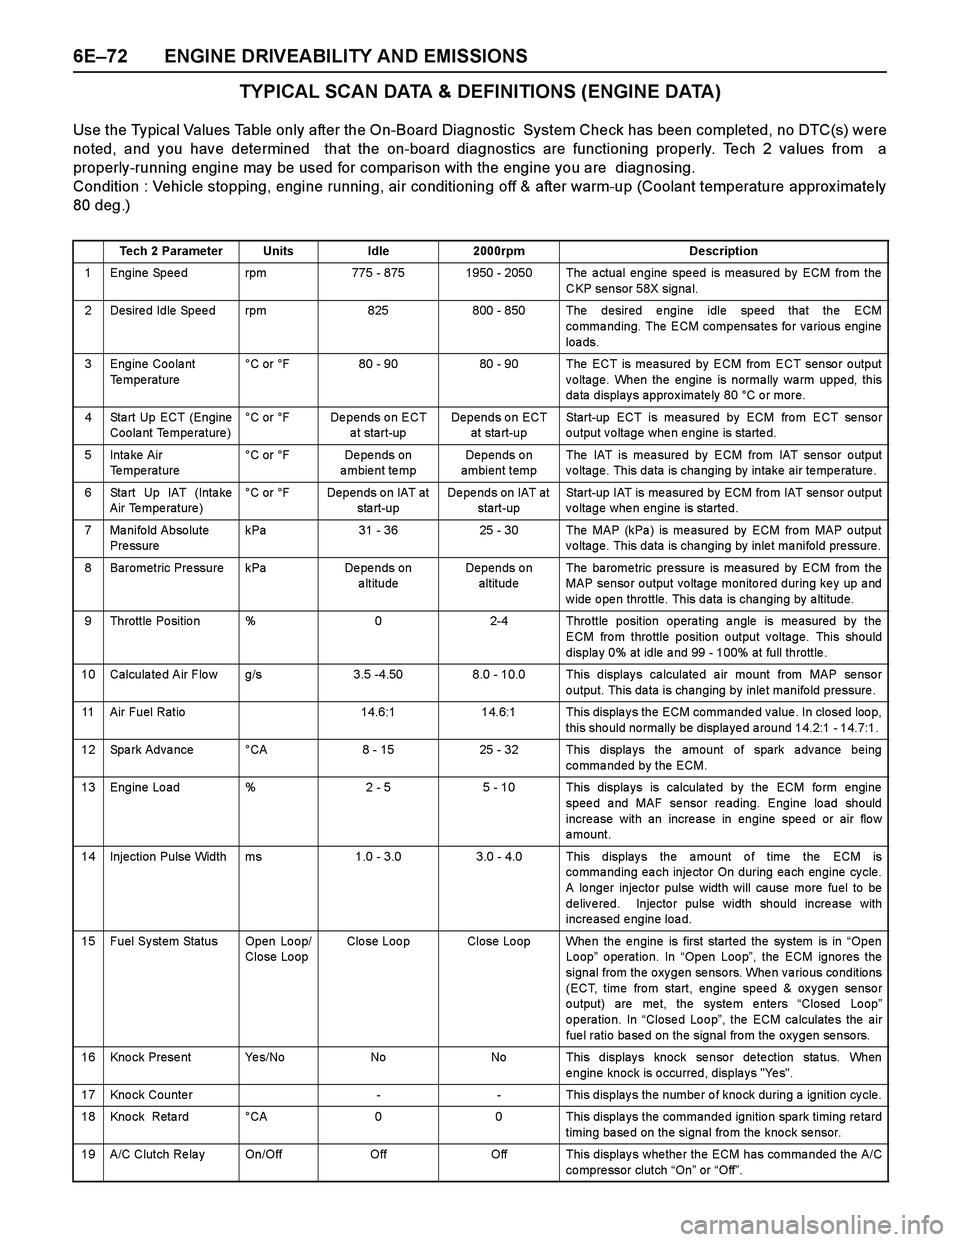
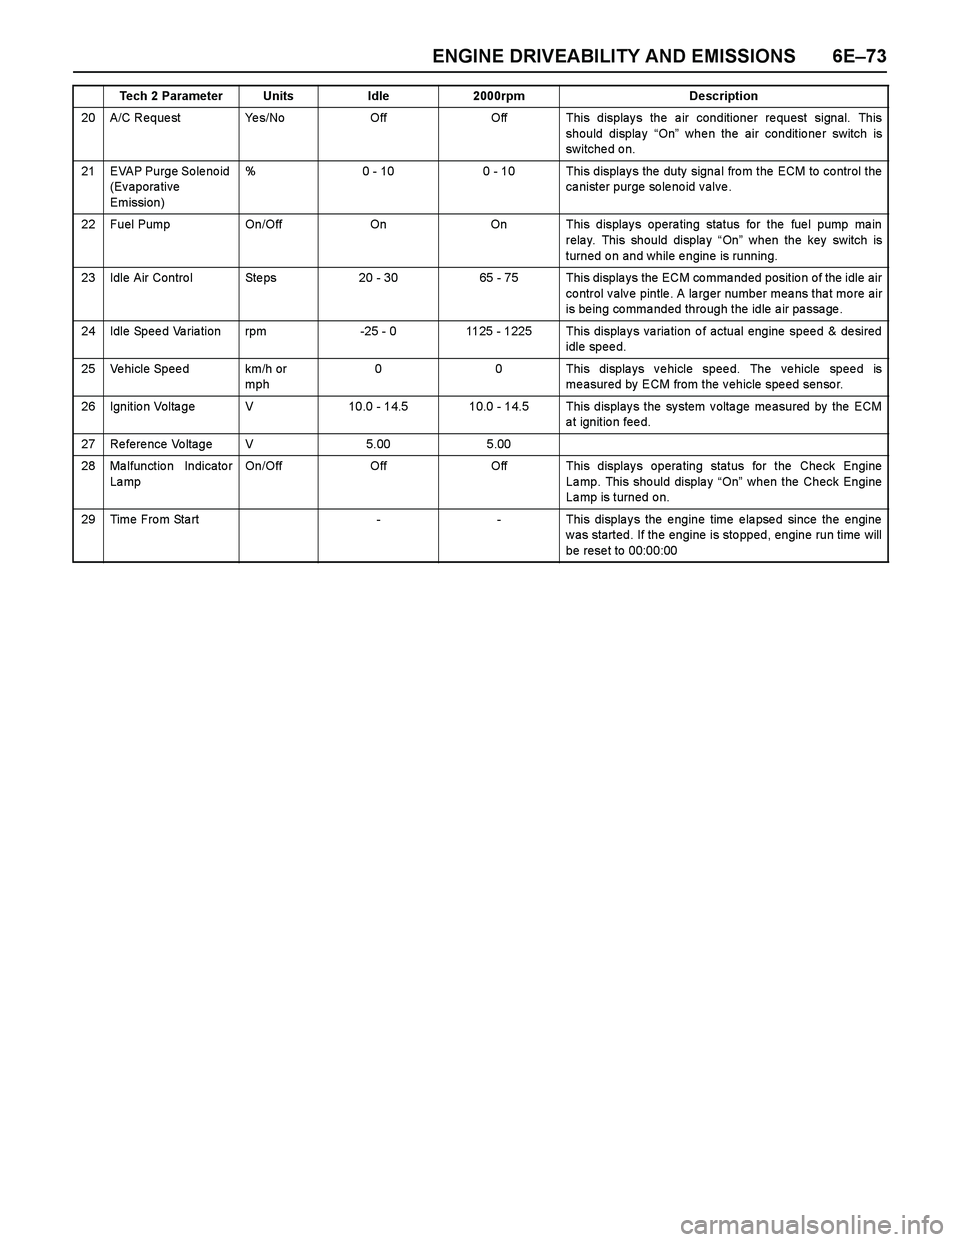
TYPICAL SCAN DATA & DEFINITIONS (ENGINE DATA)
Use the Typical Values Table only after the On-Board Diagnostic System Check has been completed, no DTC(s) were
noted, and you have determined that the on-board diagnostics are functioning properly. Tech 2 values from a
properly-running engine may be used for comparison with the engine you are diagnosing.
Condition : Vehicle stopping, engine running, air conditioning off & after warm-up (Coolant temperature approx imately
80 deg.)
Tech 2 ParameterUnitsIdle2000rpmDescription
1 Engine Speed rpm775 - 8751950 - 2050 The actual engine speed is measured by ECM from the
CKP sensor 58X signal.
2 Desired Idle Speed rpm825800 - 850 The desired engine idle speed that the ECM
commanding. The ECM compensates for various engine
loa ds.
3 Engine Coolant
Te mpe rature°C or °F80 - 9080 - 90 The ECT is measured by ECM from ECT sensor output
voltage. When the engine is normally warm upped, this
data displays approximately 80 °C or more.
4 Sta rt Up ECT (Engine
Coolant Temperature)°C or °FDepends on ECT
a t start-upDepends on ECT
at sta rt-upStart-up ECT is measured by ECM from ECT sensor
output voltage when engine is started.
5Inta ke Air
Temperature °C or °FDe pe nds on
ambient tempDepends on
ambient tempThe IAT is mea sure d by ECM from IAT sensor o utput
voltage. This data is changing by intake air temperature.
6 Sta rt Up IAT (Inta ke
Air Temperature)°C or °FDepends on IAT at
sta rt-upDepends on IAT at
start-upStart-up IAT is me asured by ECM fro m IAT se nso r o utput
voltage when engine is started.
7 Manifold Absolute
Pre ssurekPa31 - 3625 - 30The MAP (kPa ) is me asure d by ECM fro m MAP o utput
voltage. This data is changing by inlet manifold pressure.
8 Barometric Pressure kPaDe pe nds on
altitudeDepends on
altitudeThe ba rome tric pre ssure is me asured by ECM fro m the
MAP sensor output voltage monitored during key up and
w ide o pe n thro ttle. This data is cha nging by a ltitude.
9 Throttle Position %02-4 Throttle position operating angle is measured by the
ECM from throttle position output voltage. This should
displa y 0% at idle a nd 99 - 100% at full throttle .
10 Calculated Air Flow g/s3.5 -4.508.0 - 10.0 This displays calculated air mount from MAP sensor
output. This data is changing by inlet manifold pressure .
11 Air Fuel Ratio14.6:114.6:1 This displays the ECM commanded value. In closed loop,
this should normally be displayed around 14.2:1 - 14.7:1.
12 Spark Advance °CA8 - 1525 - 32 This displays the amount of spark advance being
commanded by the ECM.
13 Engine Load %2 - 55 - 10 This displays is calculated by the ECM form engine
speed and MAF sensor reading. Engine load should
incre ase with an incre ase in engine spe ed or air flo w
amount.
14 Injection Pulse Width ms1.0 - 3.0 3.0 - 4.0 This displays the amount of time the ECM is
commanding each injector On during each engine cycle.
A lo nger injecto r pulse width will ca use more fuel to be
delivered. Injector pulse width should increase with
increased engine load.
15 Fuel System Status Open Loop/
Close LoopClo se Loo pClose Loop When the engine is first started the system is in “Open
Loop” operation. In “Open Loop”, the ECM ignores the
signal from the oxygen sensors. When various conditions
(ECT, time from start, engine speed & oxygen sensor
o utput) are me t, the syste m e nte rs “Closed Lo op”
o pera tio n. In “Close d Lo o p”, the ECM ca lculate s the air
fuel ratio based on the signal from the oxygen sensors.
16 Knock Present Yes/NoNoNo This displays knock sensor detection status. When
engine knock is occurred, displays "Yes".
17 Knock Counter-- This displays the number of knock during a ignition cycle.
18 Kno ck Reta rd °CA00 This displa ys the commande d ignitio n spa rk timing re tard
timing based on the signal from the knock sensor.
19 A/C Clutch Re la y On/OffOffOff This display s whe the r the ECM has co mma nde d the A/C
co mpre ssor clutch “On” or “Off”.
Page 2649 of 4264
ENGINE DRIVEABILITY AND EMISSIONS 6E–73
20 A/C Reque st Ye s/NoOffOff This displays the air conditioner request signal. This
should display “On” whe n the air conditio ne r switch is
switche d o n.
21 EVAP Purge So le no id
(Evaporative
Emission)%0 - 100 - 10 This display s the duty signa l fro m the ECM to co ntrol the
ca nister purge so le no id v alve .
22 Fuel Pump On/OffOnOn This displays operating status for the fuel pump main
relay. This should display “On” when the key switch is
turned on and while engine is running.
23 Idle Air Contro l Ste ps20 - 3065 - 75 This displays the ECM commanded position of the idle air
control valve pintle. A larger number means that more air
is being commanded through the idle air passage.
24 Idle Speed Variation rpm-25 - 01125 - 1225 This displays variation of actual engine speed & desired
idle speed.
25 Vehicle Speed km/h or
mph00 This displays vehicle speed. The vehicle speed is
me asured by ECM from the v ehicle spe ed senso r.
26 Ignition Voltage V10.0 - 14.510.0 - 14.5 This displays the system voltage measured by the ECM
at ignition feed.
27 Reference Voltage V5.005.00
28 Ma lfunctio n Indicato r
La mpOn/OffOffOff This displays operating status for the Check Engine
La mp. This sho uld displa y “On” when the Check Engine
Lamp is turned on.
29Time From Start--This displays the engine time elapsed since the engine
was started. If the engine is stopped, engine run time will
be rese t to 00:00:00
Tech 2 ParameterUnitsIdle2000rpmDescription
Page 2650 of 4264
6E–74 ENGINE DRIVEABILITY AND EMISSIONS
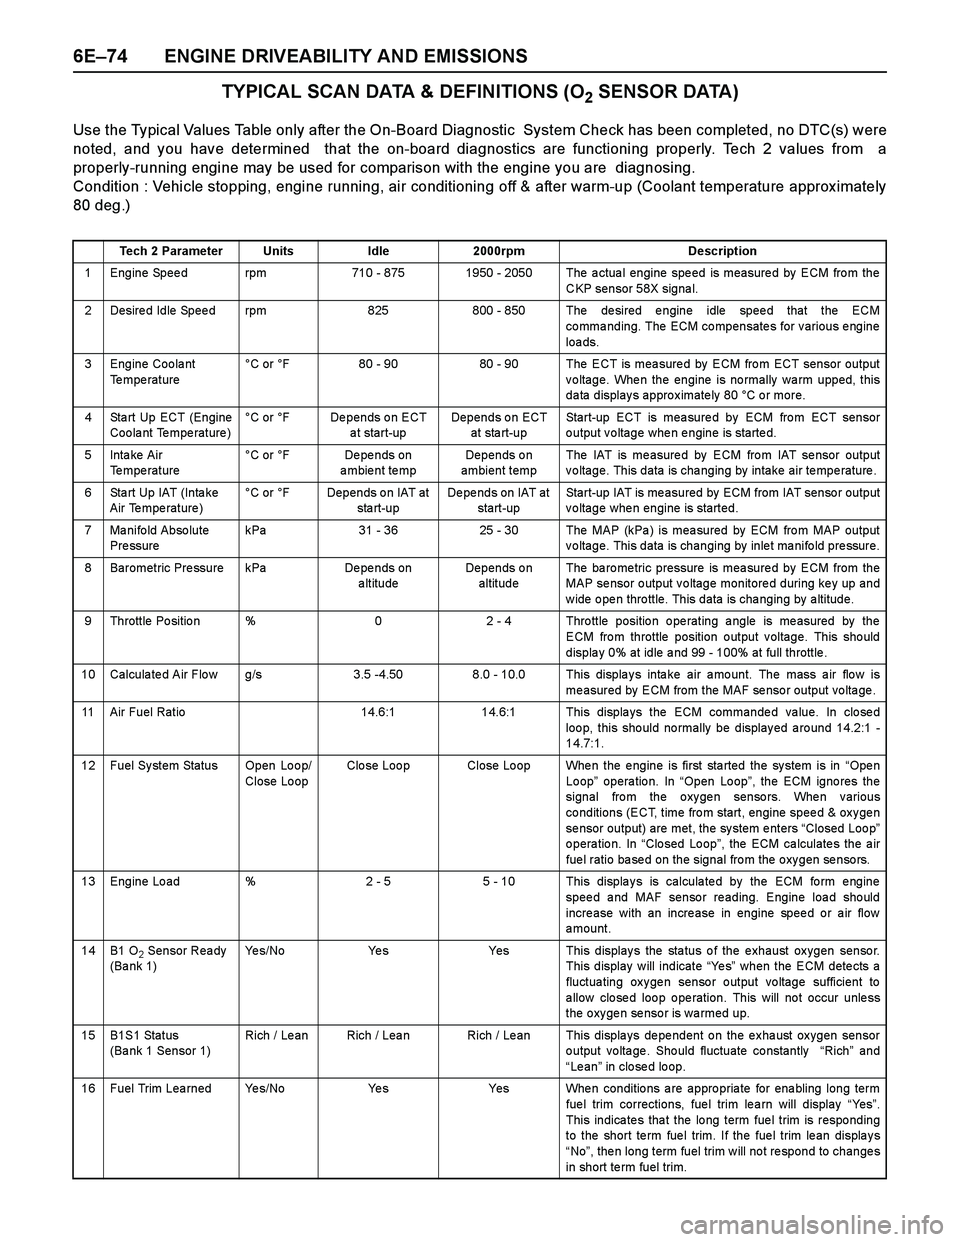
TYPICAL SCAN DATA & DEFINITIONS (O2 SENSOR DATA)
Use the Typical Values Table only after the On-Board Diagnostic System Check has been completed, no DTC(s) were
noted, and you have determined that the on-board diagnostics are functioning properly. Tech 2 values from a
properly-running engine may be used for comparison with the engine you are diagnosing.
Condition : Vehicle stopping, engine running, air conditioning off & after warm-up (Coolant temperature approx imately
80 deg.)
Tech 2 ParameterUnitsIdle2000rpmDescription
1 Engine Speed rpm710 - 8751950 - 2050 The actual engine speed is measured by ECM from the
CKP sensor 58X signal.
2 Desired Idle Speed rpm825800 - 850 The desired engine idle speed that the ECM
commanding. The ECM compensates for various engine
loa ds.
3 Engine Coolant
Te mpe rature°C or °F80 - 9080 - 90 The ECT is measured by ECM from ECT sensor output
voltage. When the engine is normally warm upped, this
data displays approximately 80 °C or more.
4 Sta rt Up ECT (Engine
Coolant Temperature)°C or °FDepends on ECT
a t start-upDepends on ECT
at sta rt-upStart-up ECT is measured by ECM from ECT sensor
output voltage when engine is started.
5Inta ke Air
Temperature °C or °FDe pe nds on
ambient tempDepends on
ambient tempThe IAT is me asure d by ECM fro m IAT se nsor output
voltage. This data is changing by intake air temperature.
6 Sta rt Up IAT (Inta ke
Air Temperature)°C or °FDepends on IAT at
sta rt-upDepends on IAT at
start-upStart-up IAT is measured by ECM from IAT sensor output
voltage when engine is started.
7 Manifold Absolute
Pre ssurekPa31 - 3625 - 30The MAP (kPa ) is mea sured by ECM fro m MAP output
voltage. This data is changing by inlet manifold pressure.
8 Barometric Pressure kPaDe pe nds on
altitudeDepends on
altitudeThe ba ro me tric pressure is mea sure d by ECM from the
MAP se nsor o utput v o ltage monitore d during ke y up and
w ide o pe n thro ttle. This data is cha nging by a ltitude.
9 Throttle Position %02 - 4 Throttle position operating angle is measured by the
ECM from throttle position output voltage. This should
displa y 0% at idle a nd 99 - 100% at full throttle .
10 Calculated Air Flow g/s3.5 -4.508.0 - 10.0 This displays intake air amount. The mass air flow is
measured by ECM from the MAF sensor output voltage.
11 Air Fuel Ratio14.6:114.6:1 This displays the ECM commanded value. In closed
loo p, this sho uld no rmally be display ed a ro und 14.2:1 -
14.7:1.
12 Fuel System Status Open Loop/
Close LoopClo se Loo pClose Loop When the engine is first started the system is in “Ope n
Loop” operation. In “Open Loop”, the ECM igno res the
signal from the oxygen sensors. When various
conditions (ECT, time from start, engine speed & oxygen
sensor output) are met, the system enters “Closed Loop”
operation. In “Closed Loop”, the ECM calculates the air
fuel ratio based on the signal from the oxygen sensors.
13 Engine Load %2 - 55 - 10 This displays is calculated by the ECM form engine
speed and MAF sensor reading. Engine load should
increase with an increase in engine speed or air flow
amount.
14B1 O2 Sensor Ready
(Ba nk 1)Ye s / N oYe sYes This displays the status of the exhaust oxygen sensor.
This display will indicate “Ye s” when the ECM detects a
fluctuating oxygen sensor output voltage sufficient to
a llow clo se d loo p o pe ration. This will no t occur unle ss
the oxygen sensor is warmed up.
15B1S1 Status
(Bank 1 Sensor 1)Rich / Le anRich / LeanRich / Lean This displays dependent on the exhaust oxygen sensor
output voltage. Should fluctuate constantly “Rich” and
“Le an” in closed loop.
16 Fuel Trim Learned Yes/NoYe sYes When conditions are appropriate for enabling long term
fue l trim corrections, fue l trim le a rn will display “Ye s”.
This indica te s tha t the lo ng term fue l trim is respo nding
to the short te rm fue l trim. If the fue l trim le an displa y s
“No”, then long term fuel trim will not respond to changes
in short te rm fuel trim.