2004 ISUZU TF SERIES display
[x] Cancel search: displayPage 2650 of 4264
6E–74 ENGINE DRIVEABILITY AND EMISSIONS
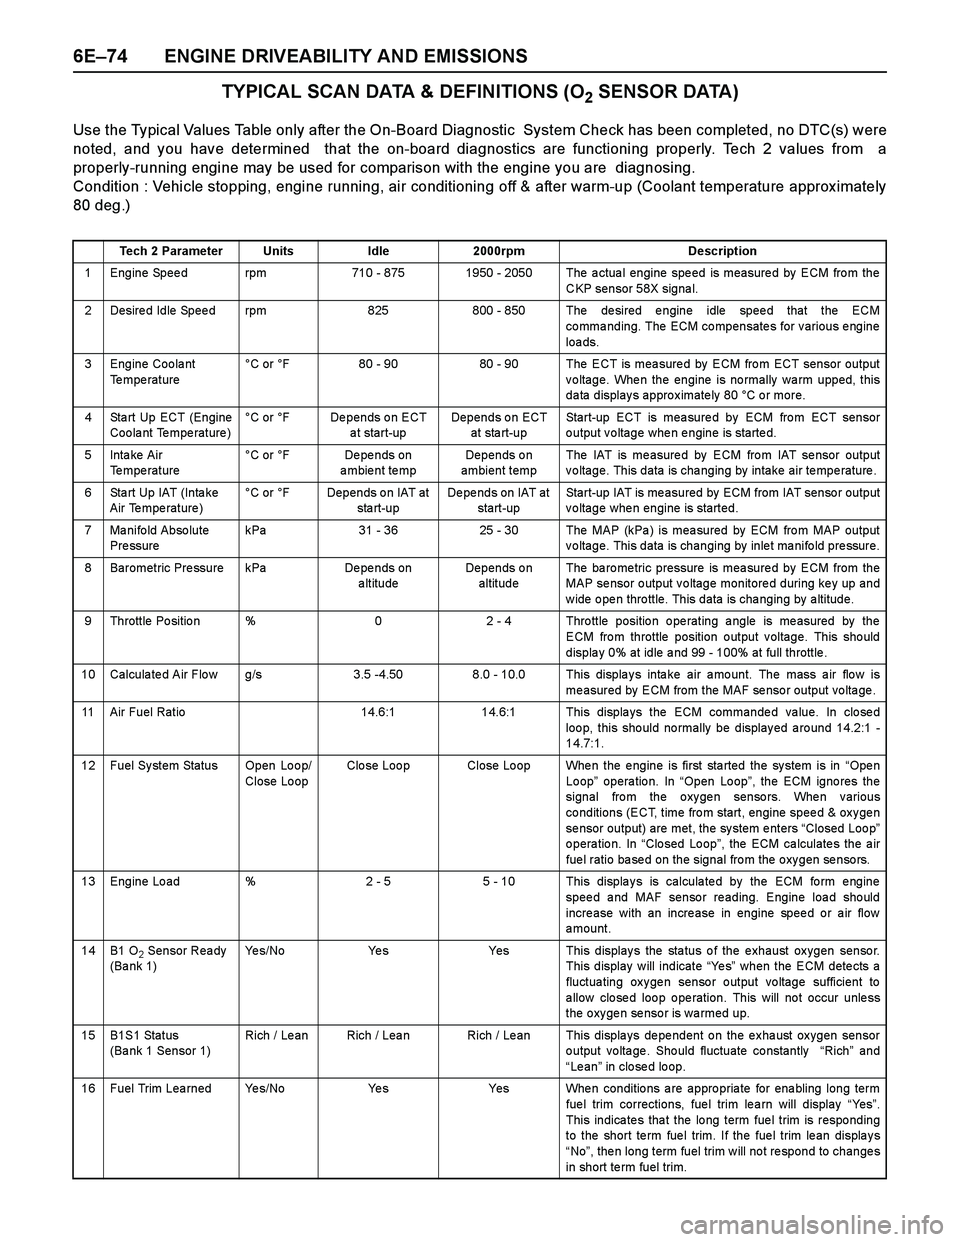
TYPICAL SCAN DATA & DEFINITIONS (O2 SENSOR DATA)
Use the Typical Values Table only after the On-Board Diagnostic System Check has been completed, no DTC(s) were
noted, and you have determined that the on-board diagnostics are functioning properly. Tech 2 values from a
properly-running engine may be used for comparison with the engine you are diagnosing.
Condition : Vehicle stopping, engine running, air conditioning off & after warm-up (Coolant temperature approx imately
80 deg.)
Tech 2 ParameterUnitsIdle2000rpmDescription
1 Engine Speed rpm710 - 8751950 - 2050 The actual engine speed is measured by ECM from the
CKP sensor 58X signal.
2 Desired Idle Speed rpm825800 - 850 The desired engine idle speed that the ECM
commanding. The ECM compensates for various engine
loa ds.
3 Engine Coolant
Te mpe rature°C or °F80 - 9080 - 90 The ECT is measured by ECM from ECT sensor output
voltage. When the engine is normally warm upped, this
data displays approximately 80 °C or more.
4 Sta rt Up ECT (Engine
Coolant Temperature)°C or °FDepends on ECT
a t start-upDepends on ECT
at sta rt-upStart-up ECT is measured by ECM from ECT sensor
output voltage when engine is started.
5Inta ke Air
Temperature °C or °FDe pe nds on
ambient tempDepends on
ambient tempThe IAT is me asure d by ECM fro m IAT se nsor output
voltage. This data is changing by intake air temperature.
6 Sta rt Up IAT (Inta ke
Air Temperature)°C or °FDepends on IAT at
sta rt-upDepends on IAT at
start-upStart-up IAT is measured by ECM from IAT sensor output
voltage when engine is started.
7 Manifold Absolute
Pre ssurekPa31 - 3625 - 30The MAP (kPa ) is mea sured by ECM fro m MAP output
voltage. This data is changing by inlet manifold pressure.
8 Barometric Pressure kPaDe pe nds on
altitudeDepends on
altitudeThe ba ro me tric pressure is mea sure d by ECM from the
MAP se nsor o utput v o ltage monitore d during ke y up and
w ide o pe n thro ttle. This data is cha nging by a ltitude.
9 Throttle Position %02 - 4 Throttle position operating angle is measured by the
ECM from throttle position output voltage. This should
displa y 0% at idle a nd 99 - 100% at full throttle .
10 Calculated Air Flow g/s3.5 -4.508.0 - 10.0 This displays intake air amount. The mass air flow is
measured by ECM from the MAF sensor output voltage.
11 Air Fuel Ratio14.6:114.6:1 This displays the ECM commanded value. In closed
loo p, this sho uld no rmally be display ed a ro und 14.2:1 -
14.7:1.
12 Fuel System Status Open Loop/
Close LoopClo se Loo pClose Loop When the engine is first started the system is in “Ope n
Loop” operation. In “Open Loop”, the ECM igno res the
signal from the oxygen sensors. When various
conditions (ECT, time from start, engine speed & oxygen
sensor output) are met, the system enters “Closed Loop”
operation. In “Closed Loop”, the ECM calculates the air
fuel ratio based on the signal from the oxygen sensors.
13 Engine Load %2 - 55 - 10 This displays is calculated by the ECM form engine
speed and MAF sensor reading. Engine load should
increase with an increase in engine speed or air flow
amount.
14B1 O2 Sensor Ready
(Ba nk 1)Ye s / N oYe sYes This displays the status of the exhaust oxygen sensor.
This display will indicate “Ye s” when the ECM detects a
fluctuating oxygen sensor output voltage sufficient to
a llow clo se d loo p o pe ration. This will no t occur unle ss
the oxygen sensor is warmed up.
15B1S1 Status
(Bank 1 Sensor 1)Rich / Le anRich / LeanRich / Lean This displays dependent on the exhaust oxygen sensor
output voltage. Should fluctuate constantly “Rich” and
“Le an” in closed loop.
16 Fuel Trim Learned Yes/NoYe sYes When conditions are appropriate for enabling long term
fue l trim corrections, fue l trim le a rn will display “Ye s”.
This indica te s tha t the lo ng term fue l trim is respo nding
to the short te rm fue l trim. If the fue l trim le an displa y s
“No”, then long term fuel trim will not respond to changes
in short te rm fuel trim.
Page 2651 of 4264
ENGINE DRIVEABILITY AND EMISSIONS 6E–75
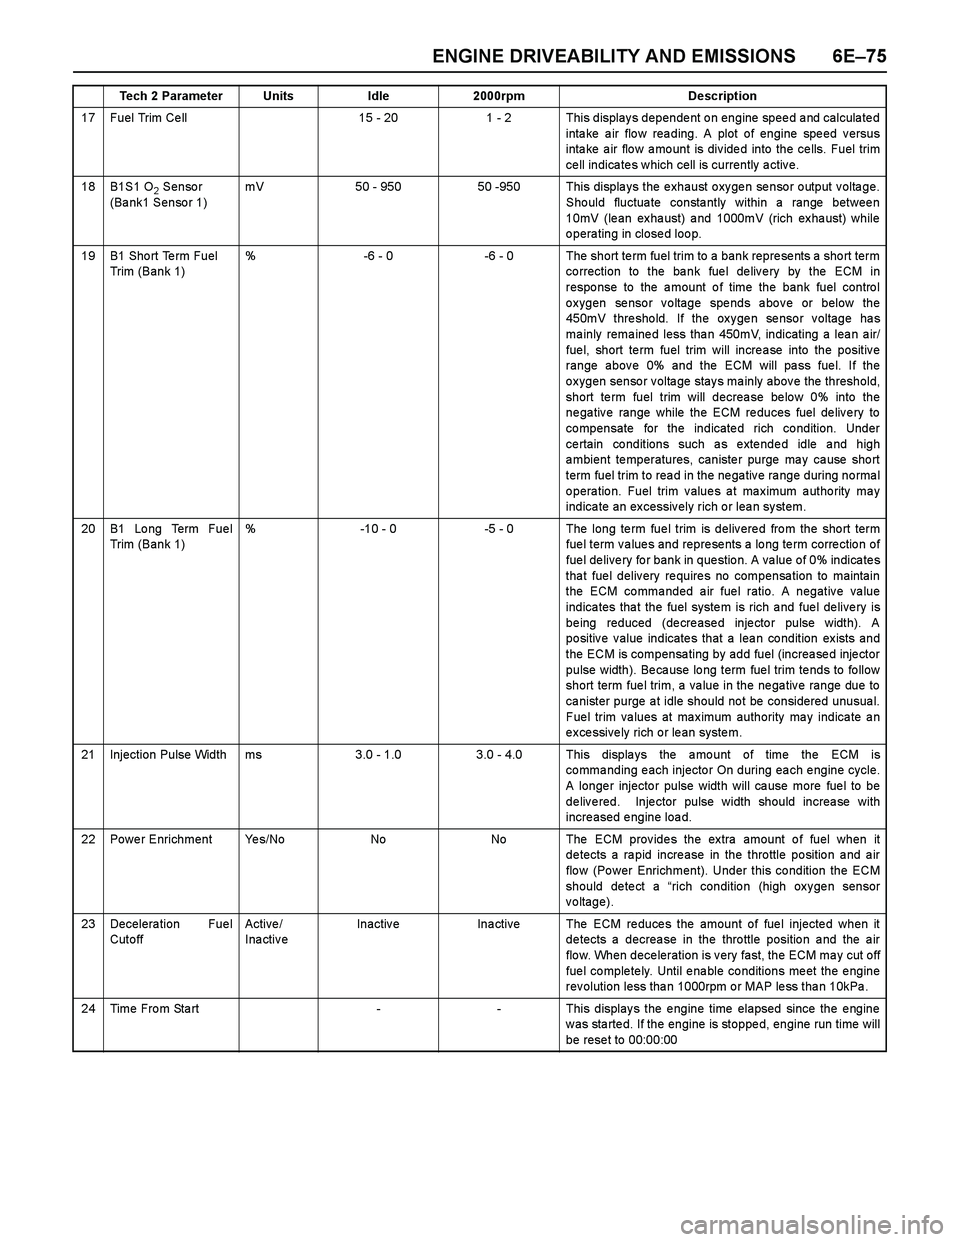
17 Fuel Trim Ce ll15 - 201 - 2 This displays dependent on engine speed and calculated
intake air flow reading. A plot of engine speed versus
inta ke a ir flo w a mo unt is div ide d into the ce lls. Fuel trim
ce ll indica te s w hich cell is currently a ctiv e.
18B1S1 O2 Sensor
(Bank1 Sensor 1)mV50 - 95050 -950 This displays the exhaust oxygen sensor output voltage.
Should fluctuate constantly within a range between
10mV (lean exhaust) and 1000mV (rich exhaust) while
operating in closed loop.
19B1 Sho rt Te rm Fuel
Trim (Bank 1)%-6 - 0-6 - 0 The short term fuel trim to a bank represents a short term
co rrection to the ba nk fue l de liv e ry by the ECM in
response to the amount of time the bank fuel control
oxygen sensor voltage spends above or below the
450mV threshold. If the oxygen sensor voltage has
ma inly rema ine d less tha n 450mV, indicating a lea n a ir/
fue l, short te rm fuel trim will incre a se into the positiv e
range above 0% and the ECM will pass fuel. If the
oxygen sensor voltage stays mainly above the threshold,
short term fuel trim will decrease below 0% into the
negative range while the ECM reduces fuel delivery to
compensate for the indicated rich condition. Under
ce rtain co nditions such a s e xte nde d idle a nd high
ambient temperatures, canister purge may cause short
term fuel trim to rea d in the ne ga tiv e ra nge during no rma l
operation. Fuel trim values at maximum authority may
indica te an ex cessiv ely rich o r lea n sy stem.
20B1 Lo ng Term Fue l
Trim (Bank 1)%-10 - 0-5 - 0 The long te rm fue l trim is deliv ere d fro m the sho rt term
fuel term values and represents a long term correction of
fuel delivery for bank in question. A value of 0% indicates
that fuel delivery requires no compensation to maintain
the ECM commanded air fuel ratio. A negative value
indica tes tha t the fuel syste m is rich a nd fue l de live ry is
being reduced (decreased injector pulse width). A
positive value indicates that a lean condition exists and
the ECM is compensating by add fuel (increased injector
pulse width). Be ca use lo ng term fue l trim te nds to fo llow
short term fuel trim, a value in the negative range due to
canister purge at idle should not be considered unusual.
Fuel trim values at maximum authority may indicate an
excessively rich or lean system.
21Injection Pulse Widthms3.0 - 1.03.0 - 4.0 This displays the amount of time the ECM is
co mma nding e ach injecto r On during ea ch e ngine cycle.
A longer injector pulse width will cause more fuel to be
delivered. Injector pulse width should increase with
increased engine load.
22Power EnrichmentYe s / N oNoNo The ECM provides the extra amount of fuel when it
detects a rapid increase in the throttle position and air
flo w (Po wer Enrichment). Under this co ndition the ECM
should detect a “rich condition (high oxygen sensor
voltage).
23Decelera tion Fue l
Cut o ff Active /
InactiveInactiveIna ctiveThe ECM reduces the amount of fuel injected when it
detects a decrease in the throttle position and the air
flow. When deceleration is very fast, the ECM may cut off
fue l co mple te ly. Until e na ble co nditions me et the e ngine
rev olution less tha n 1000rpm o r MAP le ss tha n 10kPa .
24Time From Start--This displays the engine time elapsed since the engine
w as sta rte d. If the engine is stoppe d, engine run time will
be rese t to 00:00:00
Tech 2 ParameterUnitsIdle2000rpmDescription
Page 2657 of 4264
![ISUZU TF SERIES 2004 Workshop Manual ENGINE DRIVEABILITY AND EMISSIONS 6E–81
SNAPSHOT DISPLAY WITH TIS2000
Procedures for transferring and displaying Tech2
snapshot data by using TIS2000 [Snapshot Upload]
function is described below.
S ISUZU TF SERIES 2004 Workshop Manual ENGINE DRIVEABILITY AND EMISSIONS 6E–81
SNAPSHOT DISPLAY WITH TIS2000
Procedures for transferring and displaying Tech2
snapshot data by using TIS2000 [Snapshot Upload]
function is described below.
S](/manual-img/61/57180/w960_57180-2656.png)
ENGINE DRIVEABILITY AND EMISSIONS 6E–81
SNAPSHOT DISPLAY WITH TIS2000
Procedures for transferring and displaying Tech2
snapshot data by using TIS2000 [Snapshot Upload]
function is described below.
Snapshot data can be displayed with [Snapshot Upload]
function included in TIS2000.
1. Record the snapshot data, in Tech2.
2. Transfer the snapshot data to PC.By analyzing these data in various methods, trouble
conditions can be checked.
Snapshot data is displayed by ex ecuting the three steps
below shown:
After recording the snapshot in Tech2, transfer the data
from Tech2 to PC by the below procedures.
1. Start TIS2000.
2. Select [Snapshot Upload] on the TIS2000 start
screen.
3. Select [Upload from trouble diagnosis tool (transfer
from diagnosis tester)] or click the corresponding
icon of the tool bar.
4. Select Tech2, and transfer the recorded snapshot
information. 5. Select the transferred snapshot.
6. After ending transfer of the snapshot, data
parameter list is displayed on the screen.
Page 2658 of 4264
![ISUZU TF SERIES 2004 Workshop Manual 6E–82 ENGINE DRIVEABILITY AND EMISSIONS
3. Snapshot data is displayed with TIS2000
[Snapshot Upload] function.
Snapshot is stored in the PC hard disk or floppy disk,
and can be displayed any time.
S ISUZU TF SERIES 2004 Workshop Manual 6E–82 ENGINE DRIVEABILITY AND EMISSIONS
3. Snapshot data is displayed with TIS2000
[Snapshot Upload] function.
Snapshot is stored in the PC hard disk or floppy disk,
and can be displayed any time.
S](/manual-img/61/57180/w960_57180-2657.png)
6E–82 ENGINE DRIVEABILITY AND EMISSIONS
3. Snapshot data is displayed with TIS2000
[Snapshot Upload] function.
Snapshot is stored in the PC hard disk or floppy disk,
and can be displayed any time.
Stored snapshot can be displayed by the below
procedures.
1. Start TIS2000.
2. Select [Snapshot Upload] on the TIS2000 start
screen.3. Select [Open the existing files] or click the
corresponding icon of the tool bar.
4. Select the transferred snapshot.
5. Open the snapshot, to display the data parameter
list on the screen.
Graph display Values and graphs (Max. 3 graphs):
1. Click the icon for graph display. [Graph Parameter]
window opens.
2. Click the first graph icon of the window upper part,
and select one parameter from the list of the window
lower part. Selected parameter is displayed nest to
the graph icon. Graph division can be selected in
the field on the parameter right side.
3. Repeat the same procedures with the 2nd and 3rd
icons.
4. After selecting all parameters to be displayed (Max .
3 parameters), click [OK] button.
5. Parameter selected is displayed in graph form on
the right of the data parameter on the screen. 6. Graph display can be moved with the navigation
icon.
7. For displaying another parameter by graph, click the
parameter of the list, drug the mouse to the display
screen while pressing the mouse button and release
the mouse button. New parameter is displayed at
the position of the previous parameter. For
displaying the graph display screen in full size,
move the cursor upward on the screen. When the
cursor is changed to the magnifying glass form, click
the screen. Graph screen is displayed on the whole
screen.
Page 2659 of 4264
![ISUZU TF SERIES 2004 Workshop Manual ENGINE DRIVEABILITY AND EMISSIONS 6E–83
Display of graphs on one screen (Max. 6 graphs):
1. Click the 6 graph icon. [Graph Parameter] window
opens.
2. Click the graph icon, select the parameter to ISUZU TF SERIES 2004 Workshop Manual ENGINE DRIVEABILITY AND EMISSIONS 6E–83
Display of graphs on one screen (Max. 6 graphs):
1. Click the 6 graph icon. [Graph Parameter] window
opens.
2. Click the graph icon, select the parameter to](/manual-img/61/57180/w960_57180-2658.png)
ENGINE DRIVEABILITY AND EMISSIONS 6E–83
Display of graphs on one screen (Max. 6 graphs):
1. Click the 6 graph icon. [Graph Parameter] window
opens.
2. Click the graph icon, select the parameter to be
displayed from the list and change divisions
according to necessity.
3. Repeat the same procedures with the graph icons,
from the 2nd to 6th.
4. Click the [OK] button to display.
5. In this case, parameters are displayed only in graph
form. All parameters are displayed in one graph.
6. The graph display screen can be moved with the
navigation icon.
Page 2660 of 4264
6E–84 ENGINE DRIVEABILITY AND EMISSIONS
SERVICE PROGRAMMING SYSTEM (SPS)
The procedure to program the control unit by using the
Service Programming System (SPS) software contained
in TIS2000 is ex plained below.
NOTE:
If the Engine Control Module (ECM) was
programmed, the Immobilizer System must be
linked to the ECM: Refer to section 11
“Immobilizer System-ECM replacement” for the
ECM/Immobilizer linking procedure.
Should Tech2 display "SPS Procedure was not
successful", engine will not start, but no DTCs
are present, low battery voltage or poor electrical
connections should be the primary suspects.
Perform the SPS procedure again after rectifying
the fault/s.IMPORTANT:
Perform the following checks before attempting to
program the control unit:
The Tech2 PCMCIA card is programmed with The
latest software release.
The latest release of TIS2000 is loaded on the PC.
The vehicle battery is fully charged.
The control unit to be programmed is connected
to the vehicle.
1. Preparations of TIS 2000
1. Connect Tech 2 to P/C.
2. Check to see if Hardware Key is plugged into Port.
3. Activate TIS 2000 by P/C.
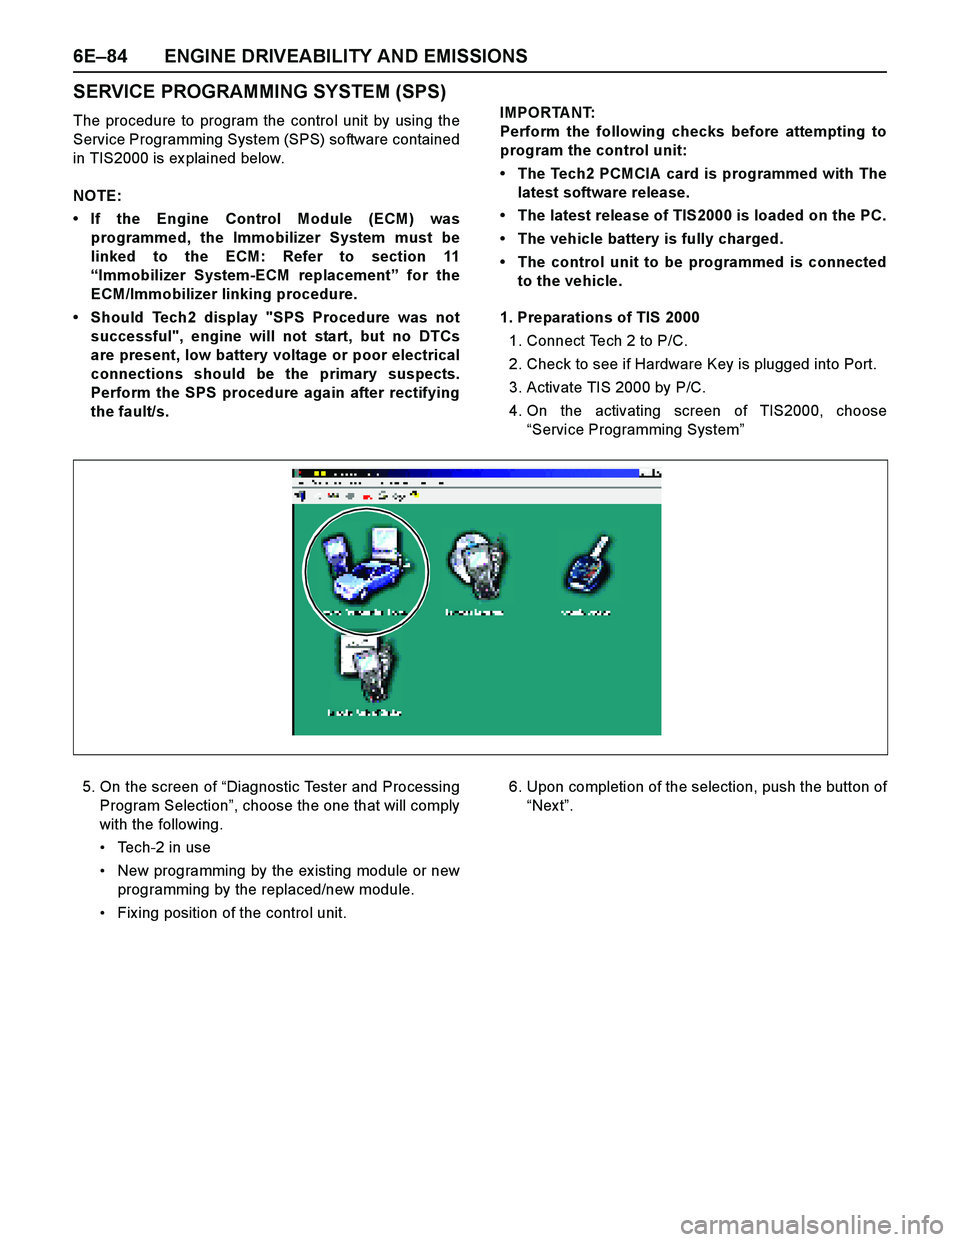
4. On the activating screen of TIS2000, choose
“Service Programming System”
5. On the screen of “Diagnostic Tester and Processing
Program Selection”, choose the one that will comply
with the following.
Tech-2 in use
New programming by the ex isting module or new
programming by the replaced/new module.
Fix ing position of the control unit.6. Upon completion of the selection, push the button of
“Nex t”.
Page 2661 of 4264
ENGINE DRIVEABILITY AND EMISSIONS 6E–85
2. Demand of Data
1. Connect Tech-2 to the vehicle. When activated by
turning on the power of Tech-2, push the “Enter”
switch.
2. Turn on the ignition switch (without starting the
engine)
3. In the main menu of Diagnostic Tester, push “F1:
Service Programming System (SPS)”.
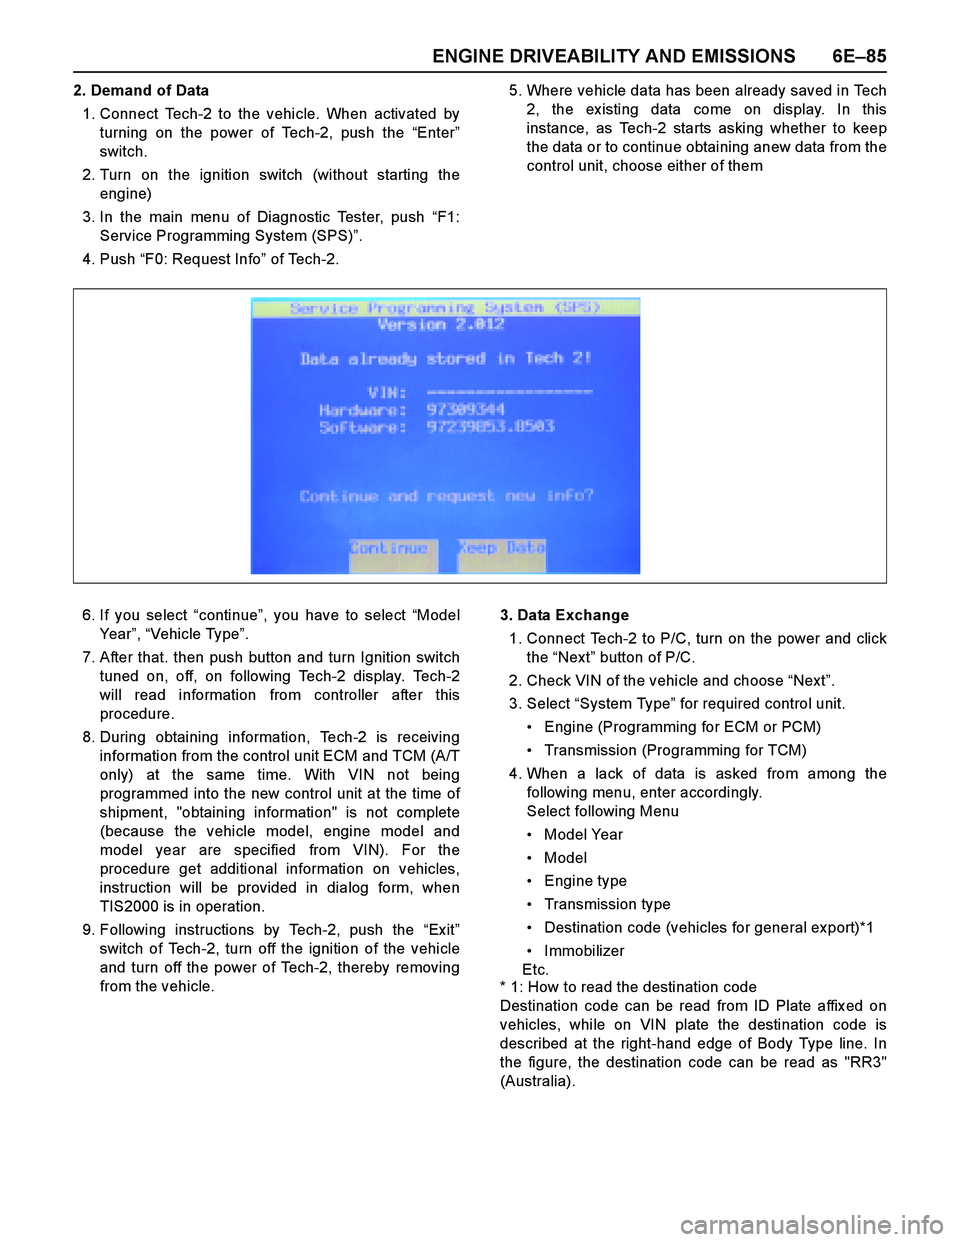
4. Push “F0: Request Info” of Tech-2.5. Where vehicle data has been already saved in Tech
2, the ex isting data come on display. In this
instance, as Tech-2 starts asking whether to keep
the data or to continue obtaining anew data from the
control unit, choose either of them
6. If you select “continue”, you have to select “Model
Year”, “Vehicle Type”.
7. After that. then push button and turn Ignition switch
tuned on, off, on following Tech-2 display. Tech-2
will read information from controller after this
procedure.
8. During obtaining information, Tech-2 is receiving
information from the control unit ECM and TCM (A/T
only) at the same time. With VIN not being
programmed into the new control unit at the time of
shipment, "obtaining information" is not complete
(because the vehicle model, engine model and
model year are specified from VIN). For the
procedure get additional information on vehicles,
instruction will be provided in dialog form, when
TIS2000 is in operation.
9. Following instructions by Tech-2, push the “Ex it”
switch of Tech-2, turn off the ignition of the vehicle
and turn off the power of Tech-2, thereby removing
from the vehicle.3. Data Exchange
1. Connect Tech-2 to P/C, turn on the power and click
the “Next” button of P/C.
2. Check VIN of the vehicle and choose “Next”.
3. Select “System Type” for required control unit.
Engine (Programming for ECM or PCM)
Transmission (Programming for TCM)
4. When a lack of data is asked from among the
following menu, enter accordingly.
Select following Menu
Model Year
Model
Engine type
Transmission type
Destination code (vehicles for general export)*1
Immobilizer
Etc.
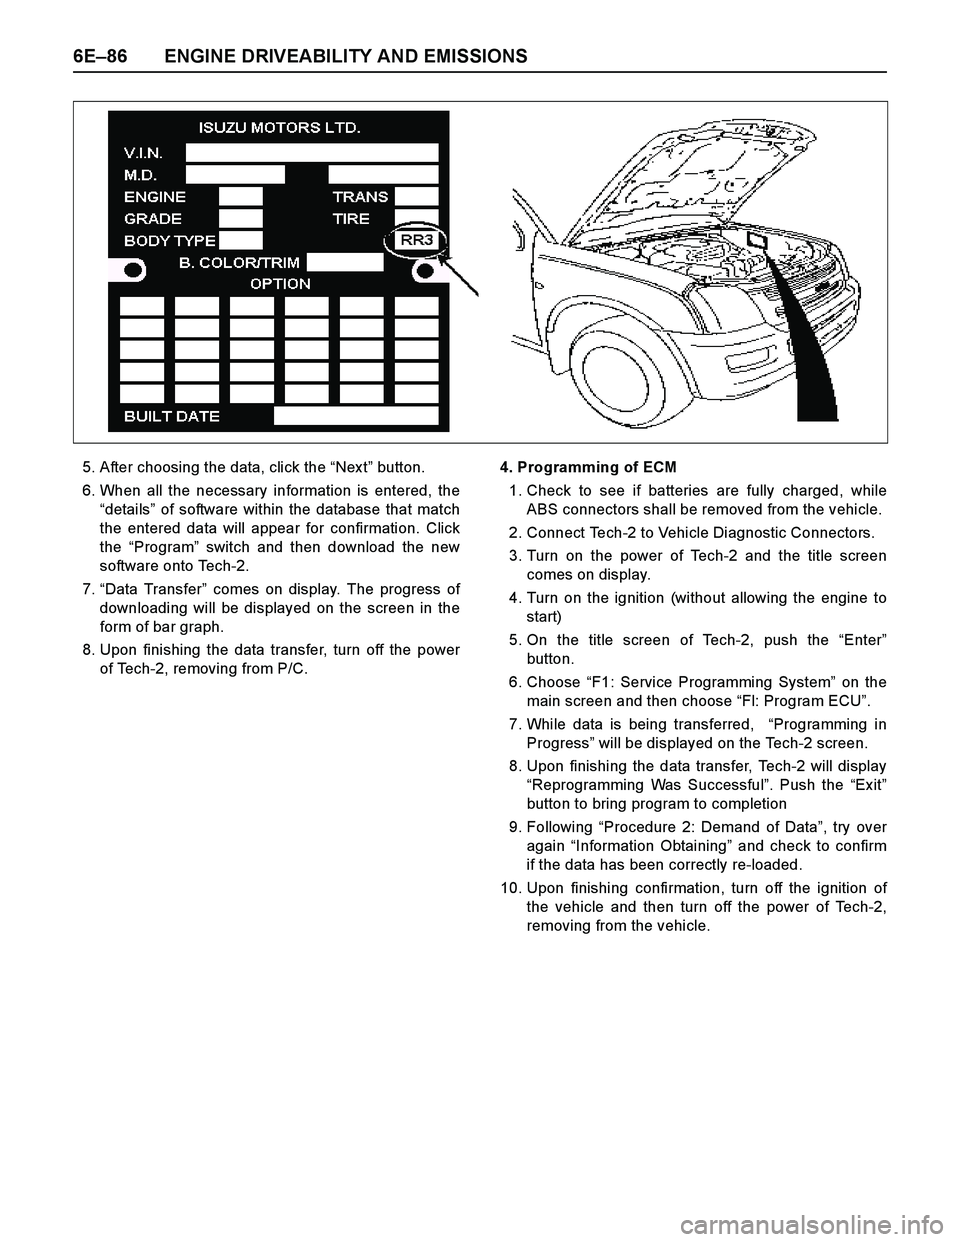
* 1: How to read the destination code
Destination code can be read from ID Plate affix ed on
vehicles, while on VIN plate the destination code is
described at the right-hand edge of Body Type line. In
the figure, the destination code can be read as "RR3"
(Australia).
Page 2662 of 4264
6E–86 ENGINE DRIVEABILITY AND EMISSIONS
5. After choosing the data, click the “Nex t” button.
6. When all the necessary information is entered, the
“details” of software within the database that match
the entered data will appear for confirmation. Click
the “Program” switch and then download the new
software onto Tech-2.
7.“Data Transfer” comes on display. The progress of
downloading will be displayed on the screen in the
form of bar graph.
8. Upon finishing the data transfer, turn off the power
of Tech-2, removing from P/C.4. Programming of ECM
1. Check to see if batteries are fully charged, while
ABS connectors shall be removed from the vehicle.
2. Connect Tech-2 to Vehicle Diagnostic Connectors.
3. Turn on the power of Tech-2 and the title screen
comes on display.
4. Turn on the ignition (without allowing the engine to
start)
5. On the title screen of Tech-2, push the “Enter”
button.
6. Choose “F1: Service Programming System” on the
main screen and then choose “Fl: Program ECU”.
7. While data is being transferred, “Programming in
Progress” will be displayed on the Tech-2 screen.
8. Upon finishing the data transfer, Tech-2 will display
“Reprogramming Was Successful”. Push the “Exit”
button to bring program to completion
9. Following “Procedure 2: Demand of Data”, try over
again “Information Obtaining” and check to confirm
if the data has been correctly re-loaded.
10. Upon finishing confirmation, turn off the ignition of
the vehicle and then turn off the power of Tech-2,
removing from the vehicle.