Page 265 of 270
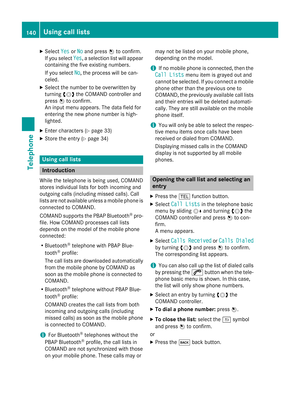
Selecting a weather station in the
map
X Move the weather map and crosshair to the
desired position (Y page 262).
X Press 0098the COMAND controller.
The menu is shown.
X Confirm Display
Display Weather
Weatherby pressing 0098.
COMAND receives the weather data for the
selected position from the nearest weather station and displays it automatically as a
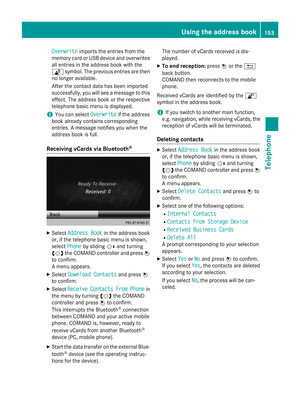
daily forecast. Switching layers on the map on/off
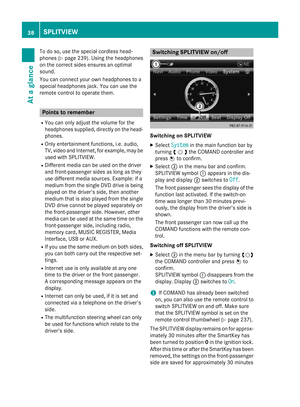
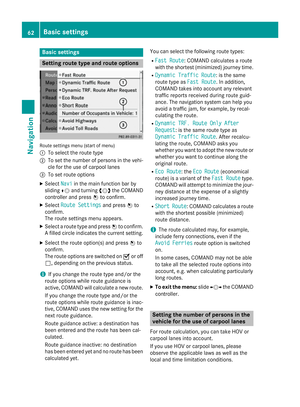
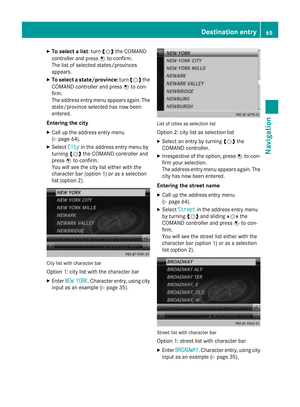
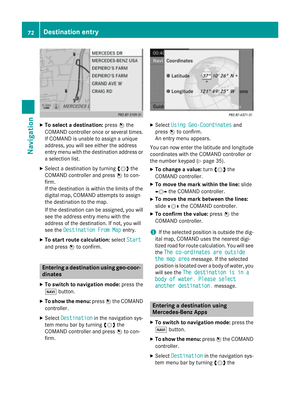
You can switch on different layers, for exam-
ple to display the rain radar, weather fronts
and the course of tropical storms on the map.
X Display the menu on the weather map
(Y page 262).
X Select Map Options
Map Options by turning00790052007Athe
COMAND controller and press 0098to con-
firm.
A menu appears.
X Select the layer by turning 00790052007Aor sliding
009700520064 the COMAND controller and press 0098
to confirm.
Switch the display on 0073or off 0053. Weather map
263SIRIUS Weather
Page 266 of 270

Explanation of the layers on the weather map
Layer Map display Selectable
scales
Radar Map Radar Map Shows the rain radar as a colored area on the map.
For an explanation of the colors, see the legend
(Y page 267). All
Storm Character‐ Storm Character‐
istics istics Shows the characteristics of a storm
Characteristics are:
R tornadic storm:
storm cell with strong winds (super cell), from
which a tornado can develop. Tornadoes are
also known as twisters.
R cyclone:
storm cells from which a tornadic storm can
develop
R hailstorm
R the likelihood of a hailstorm All
Atmospheric Atmospheric
Pressure Pressure Shows the position of high and low-pressure areas
(H, L), weather fronts and isobars 200 miles
(200 km)
500 miles
(500 km)
Tropical Storm Tropical Storm
Tracks Tracks Shows the path/directional movement speed of a
tropical storm with time and strength information All
Winds
Winds Shows the wind direction and wind speed 5 miles (5 km)
Sample displays of weather data in
the map
Weather map showing the rain radar Conditions:
theRadar Map Radar Map layer is active
(Y page 263) and weather data is available.
The precipitation radar legend can be called
up at (Y page 267). 264
Weather mapSIRIUS Weather
Page 267 of 270

Displaying storm characteristics
Conditions: theStorm Characteristics
Storm Characteristics
layer is active (Y page 263)and weather data
is available.
The example shows hail showers and tornadic
storms together with direction and speed of
propagation.
The storms legend can be called up
(Y page 267). Example: weather map with information on a
cyclone
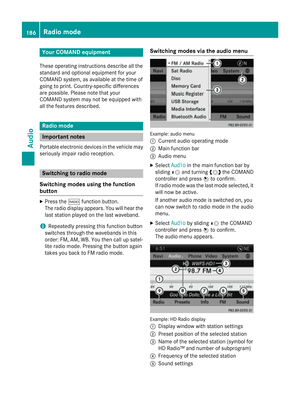
X Slide 009500520096,009700520064 or009100520078 the COMAND
controller and move the crosshair onto a
corresponding symbol.
X Press 0098the COMAND controller.
The following information is shown (if availa-
ble):
R characteristics of the storm cell
R date and time of observation (time stamp)
R directional movement speed and path
i The directional movement speed is the
speed at which the storm cell moves. Example: weather map showing weather fronts
Conditions: theAtmospheric Pressure Atmospheric Pressure
layer is switched on (Y page 263)and weather
data is available.
The example shows the position of high and
low-pressure areas (H, L), weather fronts and
isobars.
i Isobars are lines that show where the air
pressure is the same. Legend: weather fronts
0043
Cold front (blue line with blue triangles)
0044 Warm front (red line with red semi-circles)
0087 Stationary front (red-blue line with red
semi-circles and blue triangles)
0085 Occlusion (violet line with a violet semi-
circle and triangles) Weather map
265SIRIUS Weather
Page 268 of 270

Weather
front Explanation
Cold front If a cold front moves in, the
weather remains changeable
and there are often rain show-
ers and thunderstorms. The
air temperature decreases. Warm front This can mean longer periods
of rain and can lead to an
increase in cloud cover and a
slow increase in temperature. Stationary
front The weather front moves min-
imally. The weather remains
changeable in this area. Occlusion This occurs when a faster cold
front reaches an advancing
warm front and combines
with it. The weather remains
changeable and rainy within
an occlusion. Example: weather map showing the progress of a
tropical storm
0043
Position on the forecast path
0044 Current position of the cyclone
0087 Position on the previous path
Conditions: theTropical Storm Tracks Tropical Storm Tracks
layer is switched on (Y page 263) and weather
data is available.
A dotted line shows the previous path and the
forecast path of a tropical low-pressure area
(cyclone). Information on a cyclone
You can select individual points ( 0043,0044and
0087) on the path and display further informa-
tion on them.
X In the map, slide 009500520096,009700520064or009100520078 the
COMAND controller and slide the crosshair
to 0043, 0044or0087.
X Press 0098the COMAND controller.
Showing information (if available):
R name of the tropical storm and category
R time stamp
R speed and direction of propagation (Wind Wind)
R maximum wind speed ( Max. Wind Speed Max. Wind Speed)
i The directional movement speed is the
speed at which the storm cell of a tropical
storm moves.
A tropical storm is separated into different
categories according to the location at which
it develops. Region of origin Category
Atlantic, North and
South Pacific
Oceans
Tropical Low Tropical Low
Pressure System Pressure System
Atlantic, North and
South Pacific
Oceans
Tropical Rain Tropical Rain
Zone Zone
Atlantic, North and
South Pacific
Oceans
Tropical Storm Tropical Storm266
Weather mapSIRIUS Weather
Page 269 of 270

Region of origin Category
Atlantic, North and
South Pacific
Oceans
Hurricane Cate‐ Hurricane Cate‐
gory 1 gory 1
toHurri‐
Hurri‐
cane Category 5
cane Category 5 Northwestern
Pacific Ocean
Tropical Low Tropical Low
Pressure System Pressure System
Northwestern
Pacific Ocean
Tropical Cyclone Tropical Cyclone
Northwestern
Pacific Ocean
Typhoon Typhoon
Northwestern
Pacific Ocean
Super-Typhoon Super-Typhoon
You can also see the time stamp for the
weather data on map scales of 50 miles and
smaller.
The weather map shows wind directions and
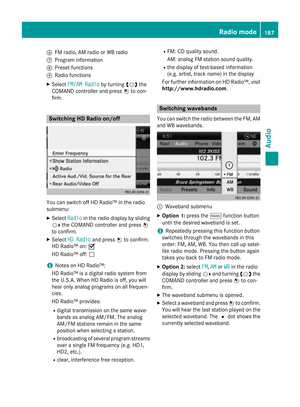
wind speeds. Legend (precipitation radar and
storms)
X
Display the menu on the weather map
(Y page 262).
X Select Map Options Map Options by turning00790052007Athe
COMAND controller and press 0098to con-
firm.
X Select Legend
Legend and press 0098to confirm.
i The symbol for a tornadic storm is also
valid for a cyclone (mesocyclone). Precipitation type Color scale
Rain Seven color levels
from light (light
green) to heavy (red)
Mixed Light (light violet) to
heavy (violet)
Snow Light (light tur-
quoise) to heavy
(turquoise)
Time stamp Weather map
267SIRIUS Weather
Page 270 of 270
The time stamp shows when the weather data
was created by the weather station.
A time stamp corresponds to the time at the
vehicle's current position. The changeover
from summer time to standard time is per-
formed automatically.
X Display the menu on the weather map
(Y page 262).
X Select Map Options
Map Options by turning00790052007Athe
COMAND controller and press 0098to con-
firm.
X Select Time Stamp
Time Stamp and press0098to con-
firm. Changing to the information chart
X Display the menu on the weather map
(Y page 262).
X Select Display Weather
Display Weather and press0098to
confirm. 268
Weather mapSIRIUS Weather