2007 ISUZU KB P190 sensor
[x] Cancel search: sensorPage 2233 of 6020
ENGINE DRIVEABILITY AND EMISSIONS 6E–63
3. Check Bulletins and Troubleshooting Hints
NOTE: As estimated 30 percent of successful vehicle
repairs are diagnosed with this step!
What you should do
You should have enough information gained from
preliminary checks to accurately search for a bulletin
and other related service information. Some service
manual sections provide troubleshooting hints that
match symptoms with specific complaints.
What resources you should use
You should use the following resources for assistance in
checking for bulletins and troubleshooting hints:
• Printed bulletins
• Access ISUZU Bulletin Web site.
• Videotapes
• Service manual
4. Perform Service Manual Diagnostic Checks
What you should do
The “System Checks” in most service manual sections
and in most cells of section 8A (electrical) provide you
with:
• A systematic approach to narrowing down the possible causes of a system fault
• Direction to specific diagnostic procedures in the service manual
• Assistance to identify what systems work correctly
What resources you should use
Whenever possible, you should use the following
resources to perform service manual checks:
• Service manual
• Technical equipment (for viewing DTCs and analyzing data)
• Digital multimeter and circuit testing tools
• Other tools as needed
5a and 5b. Perform Service Manual Diagnostic Procedures
NOTE: An estimated 40 percent of successful vehicle
repairs are diagnosed with these steps!
What you should do
When directed by service manual diagnostic checks,
you must then carefully and accurately perform the
steps of diagnostic procedures to locate the fault related to the customer complaint.
What resources you should use
Whenever appropriate, you should use the following
resources to perform service manual diagnostic
procedures:
• Service manual
• Technical equipment (for analyzing diagnostic data)
• Digital multimeter and circuit testing tools
• Essential and special tools
5c. Technician Self Diagnoses
When there is no DTC stored and no matching
symptom for the condition identified in the service
manual, you must begin with a thorough understanding
of how the system(s) operates. Efficient use of the
service manual combined with you experience and a
good process of elimination will result in accurate
diagnosis of the condition.
What you should do
Step 1: Identify and understand the suspect
circuit(s)
Having completed steps 1 through 4 of the Strategy
Based Diagnostics chart, you should have enough
information to identify the system(s) or sub-system(s)
involved. Using the service manual, you should
determine and investigate the following circuit
characteristics:
• Electrical: – How is the circuit powered (power distributioncharts and/or fuse block details)?
– How is the circuit grounded (ground distribution charts)?
– How is the circuit controlled or sensed (theory of operation):
– If it is a switched circuit, is it normally open or normally closed?
– Is the power switched or is the ground switched?
– Is it a variable resistance circuit (ECT sensor or TP sensor, for example)?
– Is it a signal generating device (MAF sensor of VSS, for example)?
– Does it rely on some mechanical/vacuum device to operate?
•Physical:
– Where are the circuit components (componentlocators and wire harness routing diagrams):
– Are there areas where wires could be chafed or pinched (brackets or frames)?
– Are there areas subjected to extreme temperatures?
BACK TO CHAPTER INDEX
TO MODEL INDEX
ISUZU KB P190 2007
Page 2235 of 6020
ENGINE DRIVEABILITY AND EMISSIONS 6E–65
Step 3: Simulate the symptom and isolate the
problem
Simulate the symptom and isolate the system by
reproducing all possible conditions suggested in Step 1
while monitoring suspected circuits/components/
systems to isolate the problem symptom. Begin with the
most logical circuit/component.
Isolate the circuit by dividing the suspect system into
simpler circuits. Next, confine the problem into a smaller
area of the system. Begin at the most logical point (or
point of easiest access) and thoroughly check the
isolated circuit for the fault, using basic circuit tests.
Hints
You can isolate a circuit by:
• Unplugging connectors or removing a fuse to separate one part of the circuit from another
• If only component fails to operate, begin testing the component
• If a number of components do not operate, begin test at areas of commonality (such as power sources,
ground circuits, switches, main connectors or major
components)
• Substitute a known good part from the parts department or the vehicle system
• Try the suspect part in a known good vehicle
See Symptom Simulation Tests on the next page for
problem simulation procedures. Refer to service manual
sections 6E and 8A for information about intermittent
diagnosis. Follow procedures for basic circuit testing in
service manual section 8A.
What resources you should use
Whenever appropriate, you should use the following
resources to assist in the diagnostic process:
• Service manual
• Bulletins
• Digital multimeter (with a MIN/MAX feature)
• Tech II and Tech II upload function
• Circuit testing tools (including connector kits/ harnesses and jumper wires)
• Experience
• Intermittent problem solving simulation methods
• Customer complaint check sheet
Symptom Simulation Tests
1. Vibration
This method is useful when the customer complaint
analysis indicates that the problem occurs when the
vehicle/system undergoes some form of vibration.
For connectors and wire harness, slightly shake
vertically and horizontally. Inspect the connector joint
and body for damage. Also, tapping lightly along a
suspected circuit may be helpful. For parts and sensors, apply slight vibration to the part
with a light tap of the finger while monitoring the system
for a malfunction.
2. Heat
This method is important when the complaint suggests
that the problem occurs in a heated environment. Apply
moderate heat to the component with a hair drier or
similar tool while monitoring the system for a
malfunction.
CAUTION: Care must be take to avoid overheating
the component.
3. Water and Moisture
This method may be used when the complaint suggests
that the malfunction occurs on a rainy day or under
conditions of high humidity. In this case, apply water in a
light spray on the vehicle to duplicate the problem.
CAUTION: Care must be take to avoid directly
exposing electrical connections to water.
4. Electrical loads
This method involves turning systems ON (such as the
blower, lights or rear window defogger) to create a load
on the vehicle electrical system at the same time you
are monitoring the suspect circuit/component.
5e. Vehicle Operates as Designed
This condition refers to instances where a system
operating as designed is perceived to be unsatisfactory
or undesirable. In general, this is due to:
• A lack of understanding by the customer
• A conflict between customer expectations and vehicle design intent
• A system performance that is unacceptable to the customer
What you should do
You can verify that a system is operating as designed
by:
• Reviewing service manual functional/diagnostic checks
• Examining bulletins and other service information for supplementary information
• Compare system operation to an identical vehicle
If the condition is due to a customer misunderstanding
or a conflict between customer expectation and system
operation, you should explain the system operation to
the customer.
If the complaint is due to a case of unsatisfactory
system performance, you should contact Technical
Assistance for the latest information.
What resources you should use
Whenever possible, you should use the following
resources to facilitate the diagnostic process:
BACK TO CHAPTER INDEX
TO MODEL INDEX
ISUZU KB P190 2007
Page 2237 of 6020
ENGINE DRIVEABILITY AND EMISSIONS 6E–67
GENERAL SERVICE INFORMATION
Aftermarket Electrical and Vacuum
Equipment
Aftermarket (add-on) electrical and vacuum equipment
is defined as any equipment which connects to the
vehicle's electrical or vacuum systems that is installed
on a vehicle after it leaves the factory. No allowances
have been made in the vehicle design for this type of
equipment.
NOTE: No add-on vacuum equipment should be added
to this vehicle.
NOTE: Add-on electrical equipment must only be
connected to the vehicle's electrical system at the
battery (power and ground).
Add-on electrical equipment, even when installed to
these guidelines, may still cause the electric system to
malfunction. This may also include equipment not
connected to the vehicle electrical system such as
portable telephones and radios. Therefore, the first step
in diagnosing any electric problem is to eliminate all
aftermarket electrical equipment from the vehicle. After
this is done, if the problem still exists, it may be
diagnosed in the normal manner.
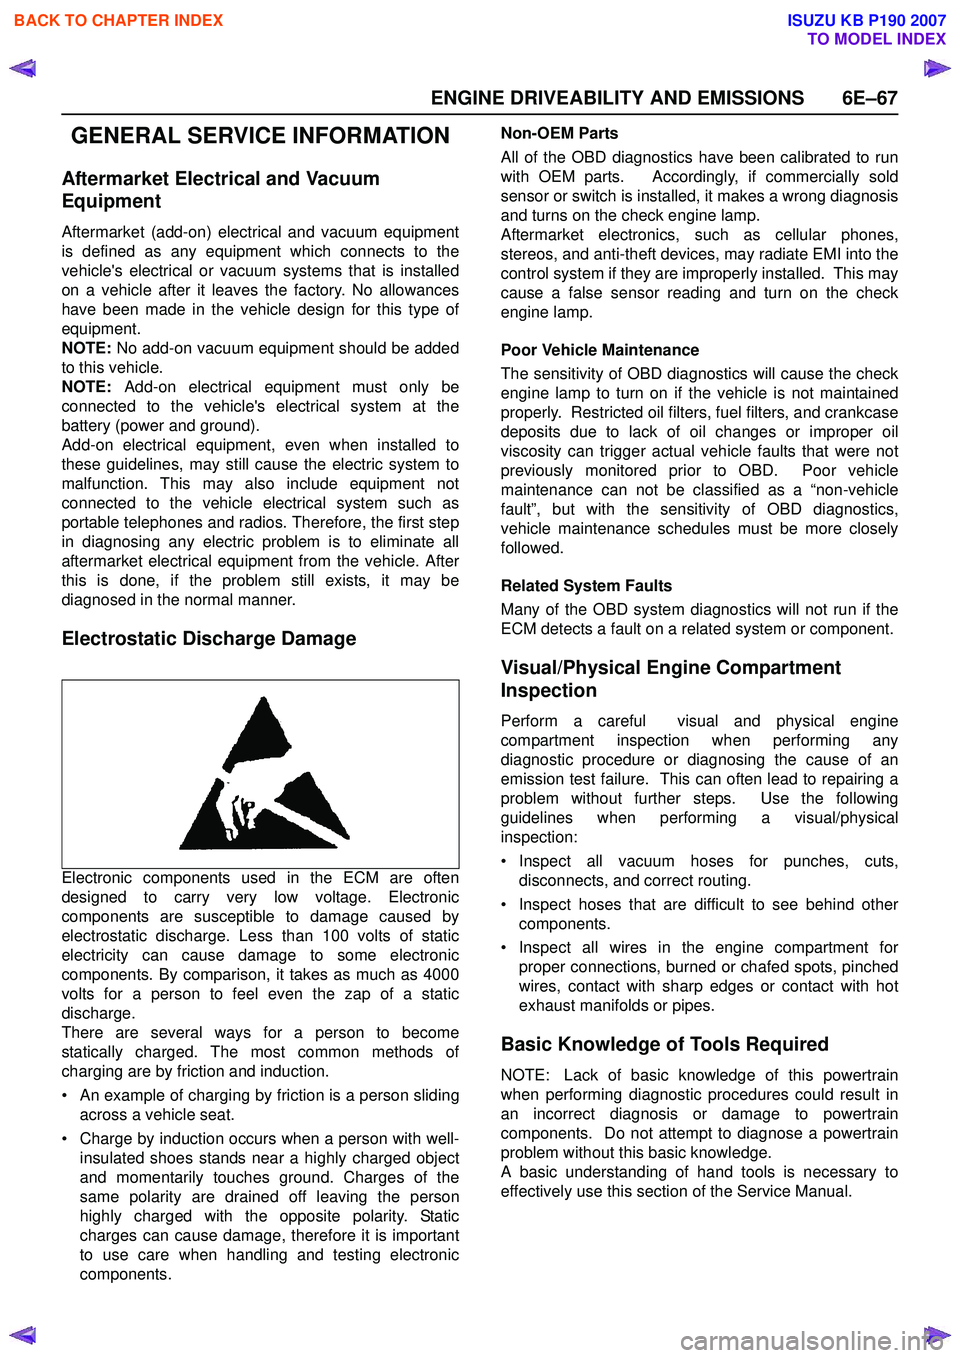
Electrostatic Discharge Damage
Electronic components used in the ECM are often
designed to carry very low voltage. Electronic
components are susceptible to damage caused by
electrostatic discharge. Less than 100 volts of static
electricity can cause damage to some electronic
components. By comparison, it takes as much as 4000
volts for a person to feel even the zap of a static
discharge.
There are several ways for a person to become
statically charged. The most common methods of
charging are by friction and induction.
• An example of charging by friction is a person sliding across a vehicle seat.
• Charge by induction occurs when a person with well- insulated shoes stands near a highly charged object
and momentarily touches ground. Charges of the
same polarity are drained off leaving the person
highly charged with the opposite polarity. Static
charges can cause damage, therefore it is important
to use care when handling and testing electronic
components. Non-OEM Parts
All of the OBD diagnostics have been calibrated to run
with OEM parts. Accordingly, if commercially sold
sensor or switch is installed, it makes a wrong diagnosis
and turns on the check engine lamp.
Aftermarket electronics, such as cellular phones,
stereos, and anti-theft devices, may radiate EMI into the
control system if they are improperly installed. This may
cause a false sensor reading and turn on the check
engine lamp.
Poor Vehicle Maintenance
The sensitivity of OBD diagnostics will cause the check
engine lamp to turn on if the vehicle is not maintained
properly. Restricted oil filters, fuel filters, and crankcase
deposits due to lack of oil changes or improper oil
viscosity can trigger actual vehicle faults that were not
previously monitored prior to OBD. Poor vehicle
maintenance can not be classified as a “non-vehicle
fault”, but with the sensitivity of OBD diagnostics,
vehicle maintenance schedules must be more closely
followed.
Related System Faults
Many of the OBD system diagnostics will not run if the
ECM detects a fault on a related system or component.
Visual/Physical Engine Compartment
Inspection
Perform a careful visual and physical engine
compartment inspection when performing any
diagnostic procedure or diagnosing the cause of an
emission test failure. This can often lead to repairing a
problem without further steps. Use the following
guidelines when performing a visual/physical
inspection:
• Inspect all vacuum hoses for punches, cuts, disconnects, and correct routing.
• Inspect hoses that are difficult to see behind other components.
• Inspect all wires in the engine compartment for proper connections, burned or chafed spots, pinched
wires, contact with sharp edges or contact with hot
exhaust manifolds or pipes.
Basic Knowledge of Tools Required
NOTE: Lack of basic knowledge of this powertrain
when performing diagnostic procedures could result in
an incorrect diagnosis or damage to powertrain
components. Do not attempt to diagnose a powertrain
problem without this basic knowledge.
A basic understanding of hand tools is necessary to
effectively use this section of the Service Manual.
BACK TO CHAPTER INDEX
TO MODEL INDEX
ISUZU KB P190 2007
Page 2241 of 6020
ENGINE DRIVEABILITY AND EMISSIONS 6E–71
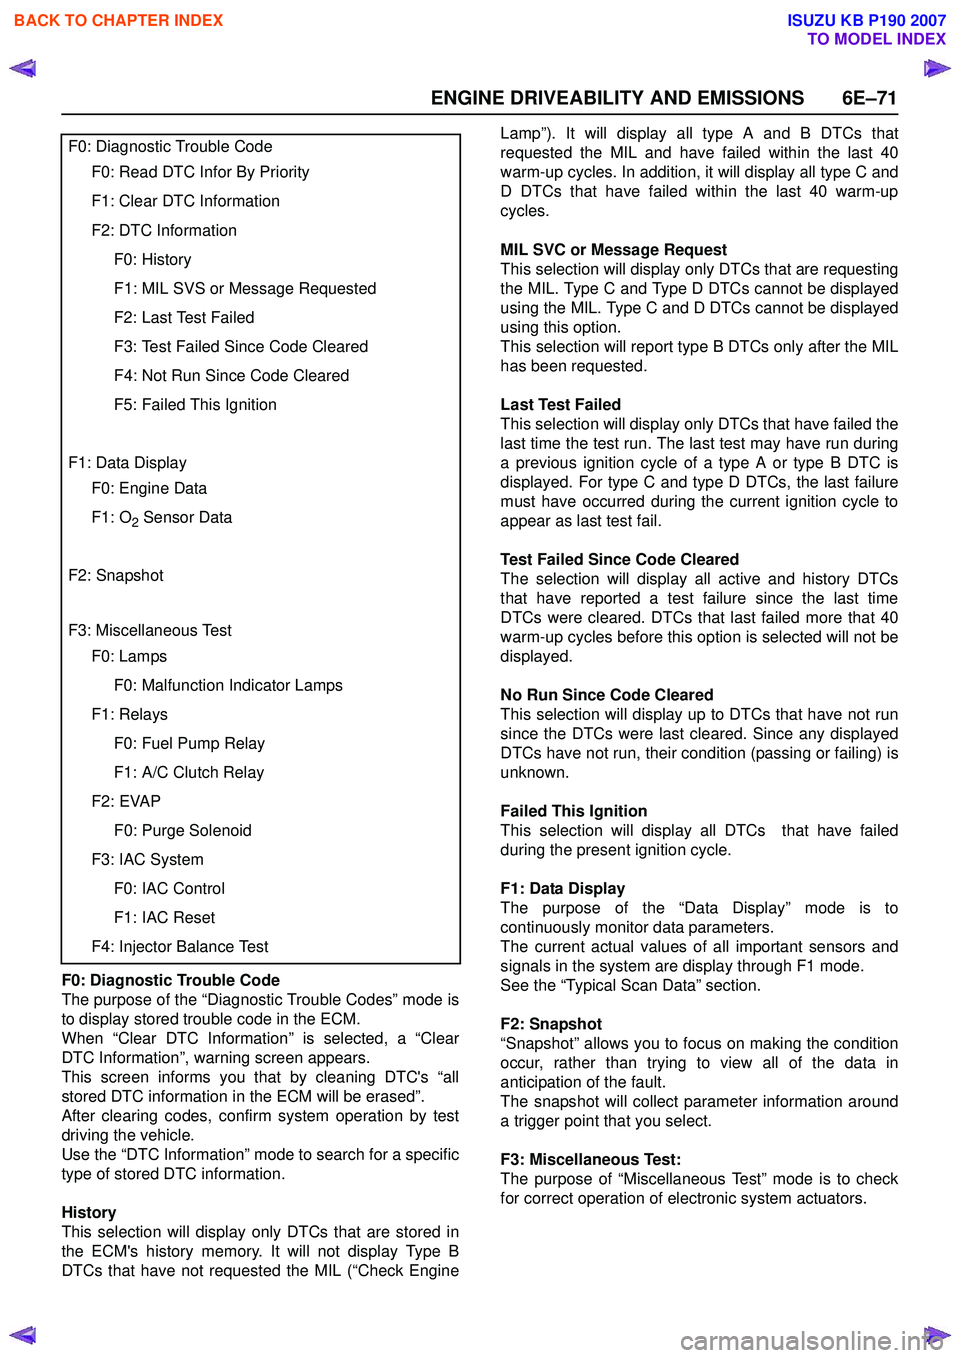
F0: Diagnostic Trouble Code
The purpose of the “Diagnostic Trouble Codes” mode is
to display stored trouble code in the ECM.
When “Clear DTC Information” is selected, a “Clear
DTC Information”, warning screen appears.
This screen informs you that by cleaning DTC's “all
stored DTC information in the ECM will be erased”.
After clearing codes, confirm system operation by test
driving the vehicle.
Use the “DTC Information” mode to search for a specific
type of stored DTC information.
History
This selection will display only DTCs that are stored in
the ECM's history memory. It will not display Type B
DTCs that have not requested the MIL (“Check Engine Lamp”). It will display all type A and B DTCs that
requested the MIL and have failed within the last 40
warm-up cycles. In addition, it will display all type C and
D DTCs that have failed within the last 40 warm-up
cycles.
MIL SVC or Message Request
This selection will display only DTCs that are requesting
the MIL. Type C and Type D DTCs cannot be displayed
using the MIL. Type C and D DTCs cannot be displayed
using this option.
This selection will report type B DTCs only after the MIL
has been requested.
Last Test Failed
This selection will display only DTCs that have failed the
last time the test run. The last test may have run during
a previous ignition cycle of a type A or type B DTC is
displayed. For type C and type D DTCs, the last failure
must have occurred during the current ignition cycle to
appear as last test fail.
Test Failed Since Code Cleared
The selection will display all active and history DTCs
that have reported a test failure since the last time
DTCs were cleared. DTCs that last failed more that 40
warm-up cycles before this option is selected will not be
displayed.
No Run Since Code Cleared
This selection will display up to DTCs that have not run
since the DTCs were last cleared. Since any displayed
DTCs have not run, their condition (passing or failing) is
unknown.
Failed This Ignition
This selection will display all DTCs that have failed
during the present ignition cycle.
F1: Data Display
The purpose of the “Data Display” mode is to
continuously monitor data parameters.
The current actual values of all important sensors and
signals in the system are display through F1 mode.
See the “Typical Scan Data” section.
F2: Snapshot
“Snapshot” allows you to focus on making the condition
occur, rather than trying to view all of the data in
anticipation of the fault.
The snapshot will collect parameter information around
a trigger point that you select.
F3: Miscellaneous Test:
The purpose of “Miscellaneous Test” mode is to check
for correct operation of electronic system actuators.
F0: Diagnostic Trouble Code
F0: Read DTC Infor By Priority
F1: Clear DTC Information
F2: DTC Information
F0: History
F1: MIL SVS or Message Requested
F2: Last Test Failed
F3: Test Failed Since Code Cleared
F4: Not Run Since Code Cleared
F5: Failed This Ignition
F1: Data Display
F0: Engine Data
F1: O2 Sensor Data
F2: Snapshot
F3: Miscellaneous Test
F0: Lamps
F0: Malfunction Indicator Lamps
F1: Relays
F0: Fuel Pump Relay
F1: A/C Clutch Relay
F2: EVAP
F0: Purge Solenoid
F3: IAC System
F0: IAC Control
F1: IAC Reset
F4: Injector Balance Test
BACK TO CHAPTER INDEX
TO MODEL INDEX
ISUZU KB P190 2007
Page 2242 of 6020
6E–72 ENGINE DRIVEABILITY AND EMISSIONS
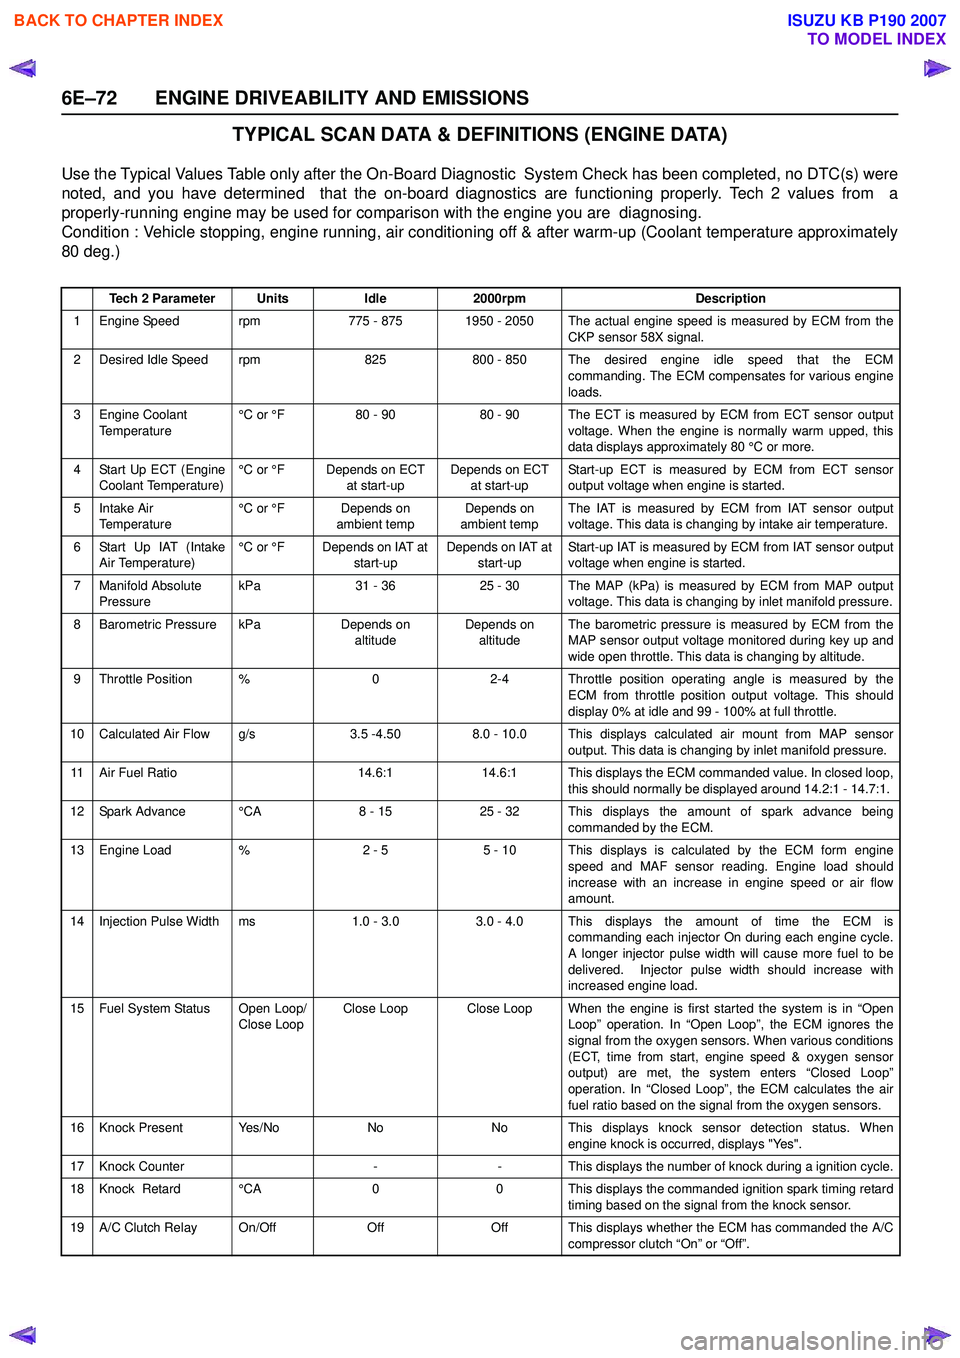
TYPICAL SCAN DATA & DEFINITIONS (ENGINE DATA)
Use the Typical Values Table only after the On-Board Diagnostic System Check has been completed, no DTC(s) were
noted, and you have determined that the on-board diagnostics are functioning properly. Tech 2 values from a
properly-running engine may be used for comparison with the engine you are diagnosing.
Condition : Vehicle stopping, engine running, air conditioning off & after warm-up (Coolant temperature approximately
80 deg.)
Tech 2 ParameterUnitsIdle2000rpmDescription
1 Engine Speed rpm775 - 8751950 - 2050 The actual engine speed is measured by ECM from the
CKP sensor 58X signal.
2 Desired Idle Speed rpm825800 - 850 The desired engine idle speed that the ECMcommanding. The ECM compensates for various engine
loads.
3 Engine Coolant Temperature °C or °F80 - 9080 - 90 The ECT is measured by ECM from ECT sensor output
voltage. When the engine is normally warm upped, this
data displays approximately 80 °C or more.
4 Start Up ECT (Engine Coolant Temperature) °C or °FDepends on ECT
at start-upDepends on ECT at start-up Start-up ECT is measured by ECM from ECT sensor
output voltage when engine is started.
5Intake Air
Temperature °C or °FDepends on
ambient tempDepends on
ambient temp The IAT is measured by ECM from IAT sensor output
voltage. This data is changing by intake air temperature.
6 Start Up IAT (Intake Air Temperature) °C or °FDepends on IAT at
start-upDepends on IAT at start-up Start-up IAT is measured by ECM from IAT sensor output
voltage when engine is started.
7 Manifold Absolute Pressure kPa31 - 3625 - 30The MAP (kPa) is measured by ECM from MAP output
voltage. This data is changing by inlet manifold pressure.
8 Barometric Pressure kPaDepends on altitudeDepends on altitude The barometric pressure is measured by ECM from the
MAP sensor output voltage monitored during key up and
wide open throttle. This data is changing by altitude.
9 Throttle Position %02-4 Throttle position operating angle is measured by the ECM from throttle position output voltage. This should
display 0% at idle and 99 - 100% at full throttle.
10 Calculated Air Flow g/s3.5 -4.508.0 - 10.0 This displays calculated air mount from MAP sensor output. This data is changing by inlet manifold pressure.
11 Air Fuel Ratio14.6:114.6:1 This displays the ECM commanded value. In closed loop,this should normally be displayed around 14.2:1 - 14.7:1.
12 Spark Advance °CA8 - 1525 - 32 This displays the amount of spark advance being commanded by the ECM.
13 Engine Load %2 - 55 - 10 This displays is calculated by the ECM form engine
speed and MAF sensor reading. Engine load should
increase with an increase in engine speed or air flow
amount.
14 Injection Pulse Width ms1.0 - 3.0 3.0 - 4.0 This displays the amount of time the ECM is commanding each injector On during each engine cycle.
A longer injector pulse width will cause more fuel to be
delivered. Injector pulse width should increase with
increased engine load.
15 Fuel System Status Open Loop/ Close LoopClose LoopClose Loop When the engine is first started the system is in “OpenLoop” operation. In “Open Loop”, the ECM ignores the
signal from the oxygen sensors. When various conditions
(ECT, time from start, engine speed & oxygen sensor
output) are met, the system enters “Closed Loop”
operation. In “Closed Loop”, the ECM calculates the air
fuel ratio based on the signal from the oxygen sensors.
16 Knock Present Yes/NoNoNo This displays knock sensor detection status. When engine knock is occurred, displays "Yes".
17 Knock Counter--This displays the number of knock during a ignition cycle.
18 Knock Retard °CA00 This displays the commanded ignition spark timing retard
timing based on the signal from the knock sensor.
19 A/C Clutch Relay On/OffOffOff This displays whether the ECM has commanded the A/C compressor clutch “On” or “Off”.
BACK TO CHAPTER INDEX
TO MODEL INDEX
ISUZU KB P190 2007
Page 2243 of 6020
ENGINE DRIVEABILITY AND EMISSIONS 6E–73
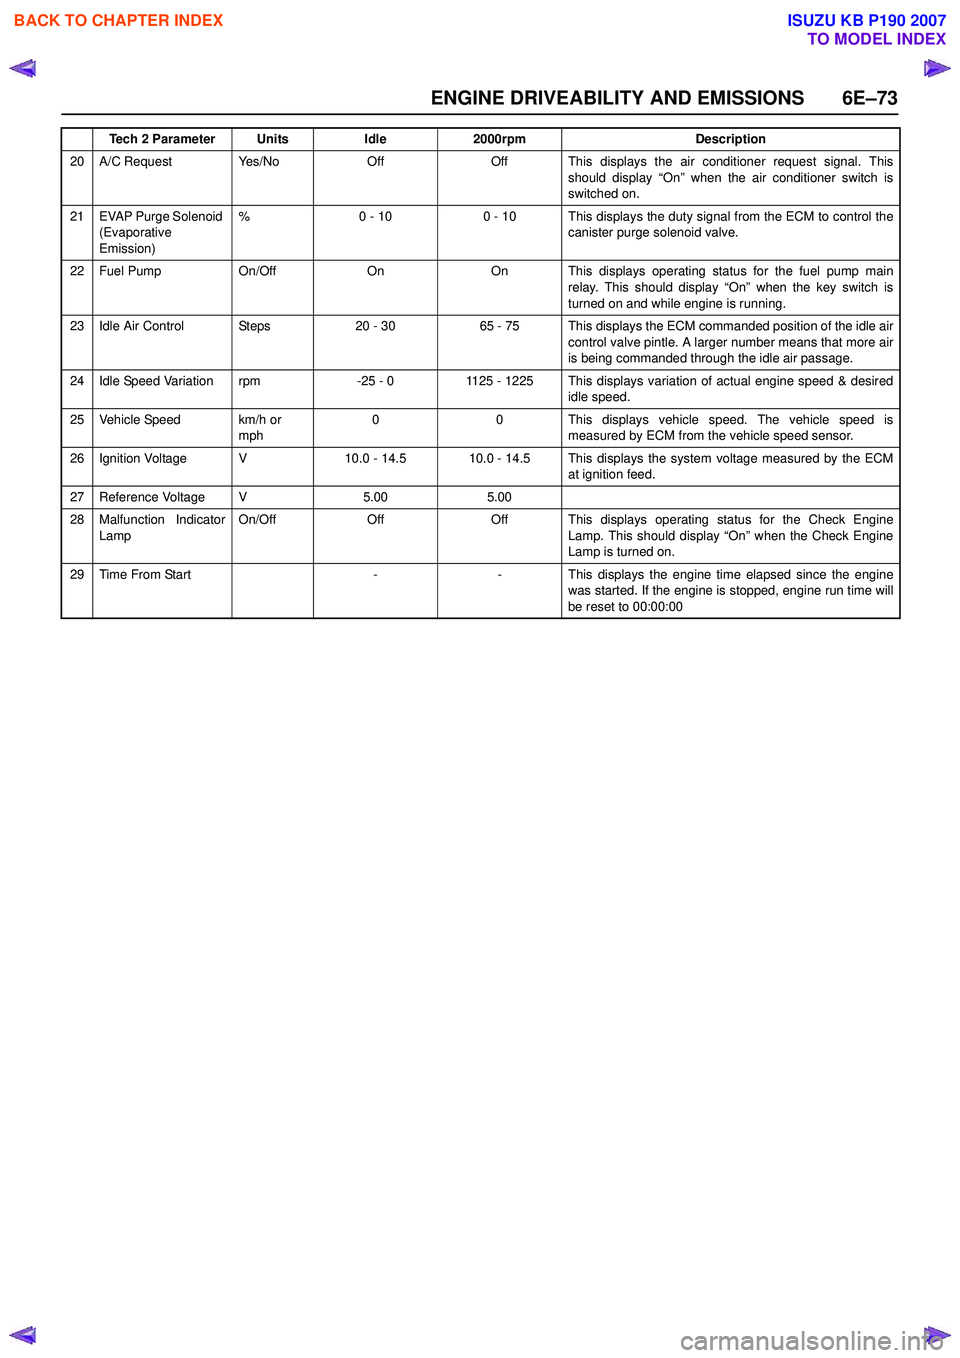
20 A/C Request Yes/NoOffOff This displays the air conditioner request signal. Thisshould display “On” when the air conditioner switch is
switched on.
21 EVAP Purge Solenoid (Evaporative
Emission) %0 - 100 - 10 This displays the duty signal from the ECM to control the
canister purge solenoid valve.
22 Fuel Pump On/OffOnOn This displays operating status for the fuel pump main
relay. This should display “On” when the key switch is
turned on and while engine is running.
23 Idle Air Control Steps20 - 3065 - 75 This displays the ECM commanded position of the idle air control valve pintle. A larger number means that more air
is being commanded through the idle air passage.
24 Idle Speed Variation rpm-25 - 01125 - 1225 This displays variation of actual engine speed & desired idle speed.
25 Vehicle Speed km/h or mph00This displays vehicle speed. The vehicle speed is
measured by ECM from the vehicle speed sensor.
26 Ignition Voltage V10.0 - 14.510.0 - 14.5 This displays the system voltage measured by the ECM at ignition feed.
27 Reference Voltage V5.005.00
28 Malfunction Indicator
Lamp On/OffOffOff This displays operating status for the Check Engine
Lamp. This should display “On” when the Check Engine
Lamp is turned on.
29Time From Start--This displays the engine time elapsed since the engine
was started. If the engine is stopped, engine run time will
be reset to 00:00:00
Tech 2 ParameterUnitsIdle2000rpmDescription
BACK TO CHAPTER INDEX
TO MODEL INDEX
ISUZU KB P190 2007
Page 2244 of 6020

6E–74 ENGINE DRIVEABILITY AND EMISSIONS
TYPICAL SCAN DATA & DEFINITIONS (O2 SENSOR DATA)
Use the Typical Values Table only after the On-Board Diagnostic System Check has been completed, no DTC(s) were
noted, and you have determined that the on-board diagnostics are functioning properly. Tech 2 values from a
properly-running engine may be used for comparison with the engine you are diagnosing.
Condition : Vehicle stopping, engine running, air conditioning off & after warm-up (Coolant temperature approximately
80 deg.)
Tech 2 ParameterUnitsIdle2000rpmDescription
1 Engine Speed rpm710 - 8751950 - 2050 The actual engine speed is measured by ECM from the
CKP sensor 58X signal.
2 Desired Idle Speed rpm825800 - 850 The desired engine idle speed that the ECMcommanding. The ECM compensates for various engine
loads.
3 Engine Coolant Temperature °C or °F80 - 9080 - 90 The ECT is measured by ECM from ECT sensor output
voltage. When the engine is normally warm upped, this
data displays approximately 80 °C or more.
4 Start Up ECT (Engine Coolant Temperature) °C or °FDepends on ECT
at start-upDepends on ECT at start-up Start-up ECT is measured by ECM from ECT sensor
output voltage when engine is started.
5Intake Air
Temperature °C or °FDepends on
ambient tempDepends on
ambient temp The IAT is measured by ECM from IAT sensor output
voltage. This data is changing by intake air temperature.
6 Start Up IAT (Intake Air Temperature) °C or °FDepends on IAT at
start-upDepends on IAT at start-up Start-up IAT is measured by ECM from IAT sensor output
voltage when engine is started.
7 Manifold Absolute Pressure kPa31 - 3625 - 30The MAP (kPa) is measured by ECM from MAP output
voltage. This data is changing by inlet manifold pressure.
8 Barometric Pressure kPaDepends on altitudeDepends on altitude The barometric pressure is measured by ECM from the
MAP sensor output voltage monitored during key up and
wide open throttle. This data is changing by altitude.
9 Throttle Position %02 - 4 Throttle position operating angle is measured by the ECM from throttle position output voltage. This should
display 0% at idle and 99 - 100% at full throttle.
10 Calculated Air Flow g/s3.5 -4.508.0 - 10.0 This displays intake air amount. The mass air flow is measured by ECM from the MAF sensor output voltage.
11 Air Fuel Ratio14.6:114.6:1 This displays the ECM commanded value. In closedloop, this should normally be displayed around 14.2:1 -
14.7:1.
12 Fuel System Status Open Loop/ Close LoopClose LoopClose Loop When the engine is first started the system is in “OpenLoop” operation. In “Open Loop”, the ECM ignores the
signal from the oxygen sensors. When various
conditions (ECT, time from start, engine speed & oxygen
sensor output) are met, the system enters “Closed Loop”
operation. In “Closed Loop”, the ECM calculates the air
fuel ratio based on the signal from the oxygen sensors.
13 Engine Load %2 - 55 - 10 This displays is calculated by the ECM form engine
speed and MAF sensor reading. Engine load should
increase with an increase in engine speed or air flow
amount.
14B1 O2 Sensor Ready
(Bank 1)Ye s / N oYe sYes This displays the status of the exhaust oxygen sensor. This display will indicate “Yes” when the ECM detects a
fluctuating oxygen sensor output voltage sufficient to
allow closed loop operation. This will not occur unless
the oxygen sensor is warmed up.
15B1S1 Status
(Bank 1 Sensor 1)Rich / LeanRich / LeanRich / Lean This displays dependent on the exhaust oxygen sensor output voltage. Should fluctuate constantly “Rich” and
“Lean” in closed loop.
16 Fuel Trim Learned Yes/NoYe sYes When conditions are appropriate for enabling long term fuel trim corrections, fuel trim learn will display “Yes”.
This indicates that the long term fuel trim is responding
to the short term fuel trim. If the fuel trim lean displays
“No”, then long term fuel trim will not respond to changes
in short term fuel trim.
BACK TO CHAPTER INDEX
TO MODEL INDEX
ISUZU KB P190 2007
Page 2245 of 6020
ENGINE DRIVEABILITY AND EMISSIONS 6E–75
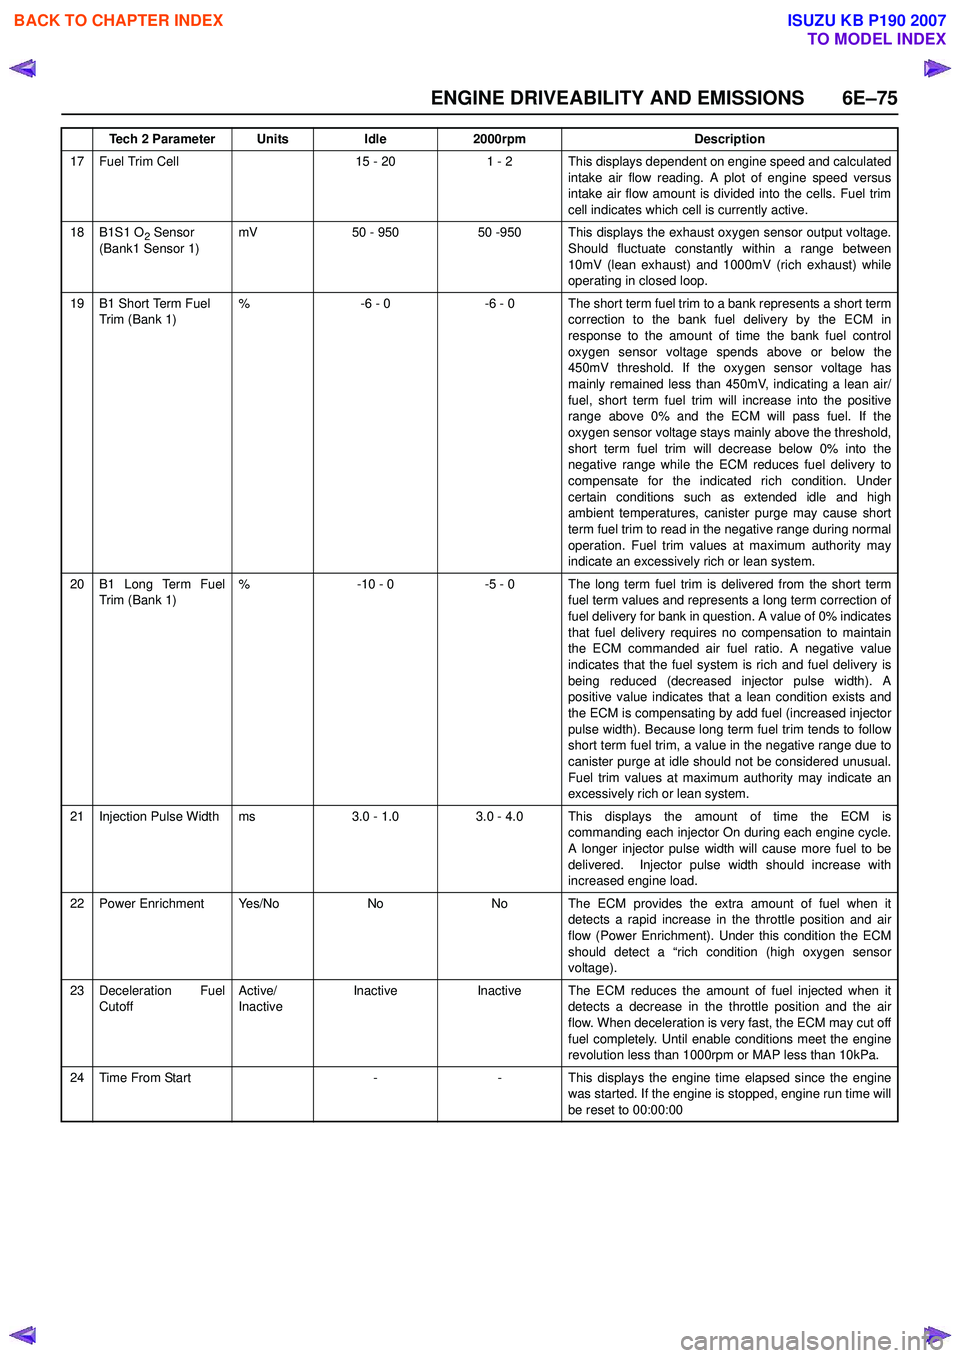
17 Fuel Trim Cell15 - 201 - 2 This displays dependent on engine speed and calculatedintake air flow reading. A plot of engine speed versus
intake air flow amount is divided into the cells. Fuel trim
cell indicates which cell is currently active.
18B1S1 O2 Sensor
(Bank1 Sensor 1)mV50 - 95050 -950 This displays the exhaust oxygen sensor output voltage. Should fluctuate constantly within a range between
10mV (lean exhaust) and 1000mV (rich exhaust) while
operating in closed loop.
19B1 Short Term Fuel
Trim (Bank 1)%-6 - 0-6 - 0 The short term fuel trim to a bank represents a short term correction to the bank fuel delivery by the ECM in
response to the amount of time the bank fuel control
oxygen sensor voltage spends above or below the
450mV threshold. If the oxygen sensor voltage has
mainly remained less than 450mV, indicating a lean air/
fuel, short term fuel trim will increase into the positive
range above 0% and the ECM will pass fuel. If the
oxygen sensor voltage stays mainly above the threshold,
short term fuel trim will decrease below 0% into the
negative range while the ECM reduces fuel delivery to
compensate for the indicated rich condition. Under
certain conditions such as extended idle and high
ambient temperatures, canister purge may cause short
term fuel trim to read in the negative range during normal
operation. Fuel trim values at maximum authority may
indicate an excessively rich or lean system.
20B1 Long Term Fuel
Trim (Bank 1)%-10 - 0-5 - 0 The long term fuel trim is delivered from the short term fuel term values and represents a long term correction of
fuel delivery for bank in question. A value of 0% indicates
that fuel delivery requires no compensation to maintain
the ECM commanded air fuel ratio. A negative value
indicates that the fuel system is rich and fuel delivery is
being reduced (decreased injector pulse width). A
positive value indicates that a lean condition exists and
the ECM is compensating by add fuel (increased injector
pulse width). Because long term fuel trim tends to follow
short term fuel trim, a value in the negative range due to
canister purge at idle should not be considered unusual.
Fuel trim values at maximum authority may indicate an
excessively rich or lean system.
21Injection Pulse Widthms3.0 - 1.03.0 - 4.0 This displays the amount of time the ECM is commanding each injector On during each engine cycle.
A longer injector pulse width will cause more fuel to be
delivered. Injector pulse width should increase with
increased engine load.
22Power EnrichmentYe s / N oNoNo The ECM provides the extra amount of fuel when it detects a rapid increase in the throttle position and air
flow (Power Enrichment). Under this condition the ECM
should detect a “rich condition (high oxygen sensor
voltage).
23Deceleration Fuel
Cutoff Active/
InactiveInactiveInactiveThe ECM reduces the amount of fuel injected when it
detects a decrease in the throttle position and the air
flow. When deceleration is very fast, the ECM may cut off
fuel completely. Until enable conditions meet the engine
revolution less than 1000rpm or MAP less than 10kPa.
24Time From Start--This displays the engine time elapsed since the engine
was started. If the engine is stopped, engine run time will
be reset to 00:00:00
Tech 2 ParameterUnitsIdle2000rpmDescription
BACK TO CHAPTER INDEX
TO MODEL INDEX
ISUZU KB P190 2007