Page 418 of 840
416
uuHonda LogR*uPerformance Monitor
Features
Performance Monitor
You can check your vehicle conditions and vi ew individual scores for different areas
of performance.
There are five screens, and you can switch between them as necessary.
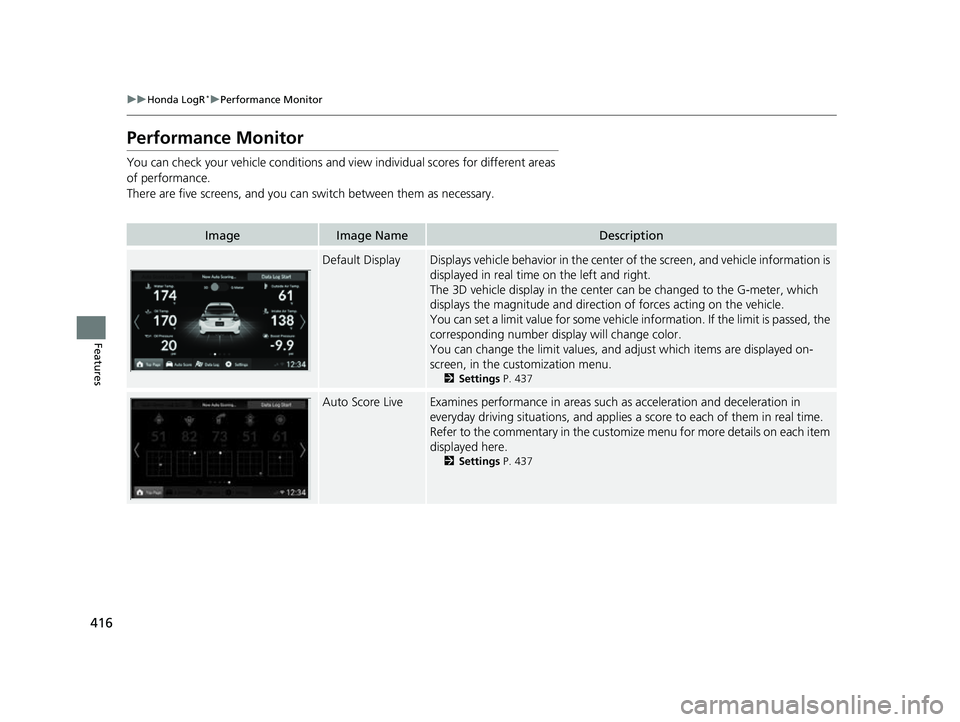
ImageImage NameDescription
Default DisplayDisplays vehicle behavior in the center of the screen, and vehicle information is
displayed in real time on the left and right.
The 3D vehicle display in the center can be changed to the G-meter, which
displays the magnitude and directio n of forces acting on the vehicle.
You can set a limit value for some vehicle information. If the limit is passed, the
corresponding number display will change color.
You can change the limit values, and adjust which items are displayed on-
screen, in the cu stomization menu.
2Settings P. 437
Auto Score LiveExamines performance in areas such as acceleration and deceleration in
everyday driving situations, and applies a score to each of them in real time.
Refer to the commentary in the customize menu for more details on each item
displayed here.
2 Settings P. 437
23 CIVIC HATCHBACK TYPE R-31T406100_03.book 416 ページ 2022年6月23日 木曜日 午後9時28分
Page 419 of 840
417
uuHonda LogR*uPerformance Monitor
Features
ImageImage NameDescription
Tire Friction Circle
DisplayDisplays the vehicle behavior in the cent er of the screen and the forces applied
to each tire by the tire friction circles.
The 3D vehicle display in the center can be changed to the G-meter, which
displays the direction and magnitude of forces acting on the vehicle.
Refer to the commentary in the cu stomize menu for more details.
2Settings P. 437
Instrument Panel
DisplayDisplays vehicle inform ation in real time.
You can set a limit value for some vehicle information. If the limit is passed, the
corresponding number display will change color.
You can change the limit values, and adjust which items are displayed on-
screen, in the customize menu.
2 Settings P. 437
Measurement Data
LogA mode designed for track driving, displa ys lap time and vehicle information in
real time.
23 CIVIC HATCHBACK TYPE R-31T406100_03.book 417 ページ 2022年6月23日 木曜日 午後9時28分
Page 421 of 840
Continued419
uuHonda LogR*uAuto Score Mode
Features
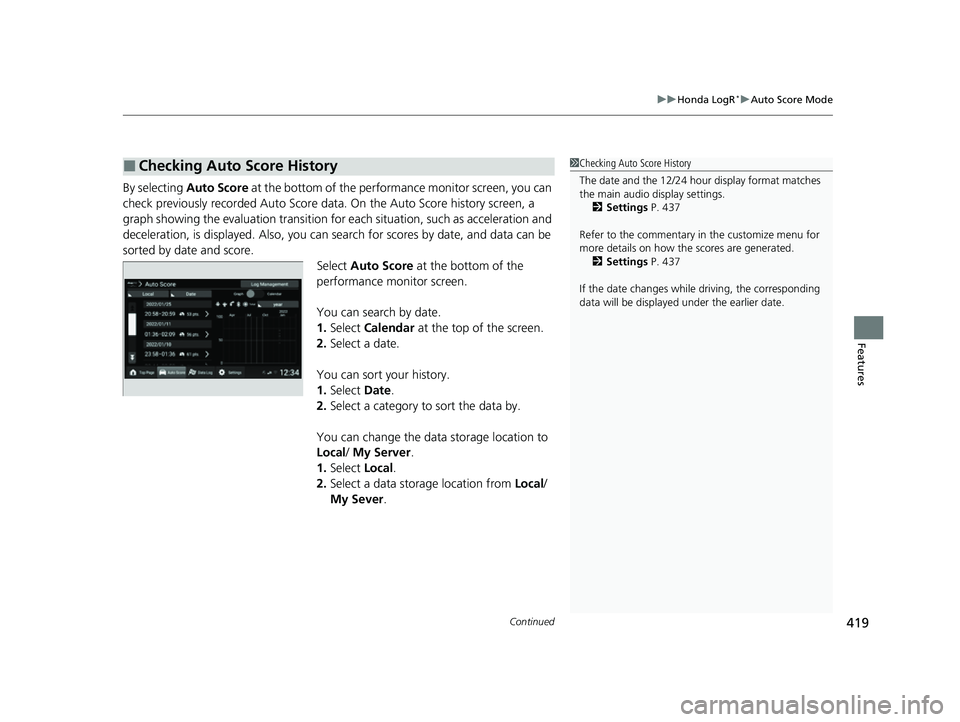
By selecting Auto Score at the bottom of the performance monitor screen, you can
check previously recorded Auto Score data. On the Au to Score history screen, a
graph showing the evaluation transition for each situation, such as acceleration and
deceleration, is displayed. Also, you can search for scores by date, and data can be
sorted by date and score. Select Auto Score at the bottom of the
performance monitor screen.
You can search by date.
1. Select Calendar at the top of the screen.
2. Select a date.
You can sort your history.
1. Select Date.
2. Select a category to sort the data by.
You can change the data storage location to
Local / My Server.
1. Select Local.
2. Select a data storage location from Local/
My Sever .
■Checking Auto Score History1Checking Auto Score History
The date and the 12/24 hour display format matches
the main audio display settings.
2 Settings P. 437
Refer to the commentary in the customize menu for
more details on how the scores are generated.
2 Settings P. 437
If the date changes whil e driving, the corresponding
data will be displaye d under the earlier date.
23 CIVIC HATCHBACK TYPE R-31T406100_03.book 419 ページ 2022年6月23日 木曜日 午後9時28分
Page 422 of 840
uuHonda LogR*uAuto Score Mode
420
Features
You can view more details by selecting a
history item.
You can view separate driving records for
each performance item that has been scored.
Select the date and time you want to view. u Separate scores and routes are displayed
corresponding to driving performance in
areas such as acceleration and
deceleration.
u You can view more detailed information
by selecting an area of performance.
■Checking Detailed Auto Score History1Checking Detailed Auto Score History
Refer to the commentary in the customize menu for
more details on how the scores are generated.
2 Settings P. 437
By selecting the icon on the map, you can switch
between map view and aerial view.
23 CIVIC HATCHBACK TYPE R-31T406100_03.book 420 ページ 2022年6月23日 木曜日 午後9時28分
Page 431 of 840
Continued429
uuHonda LogR*uData Log Mode
Features
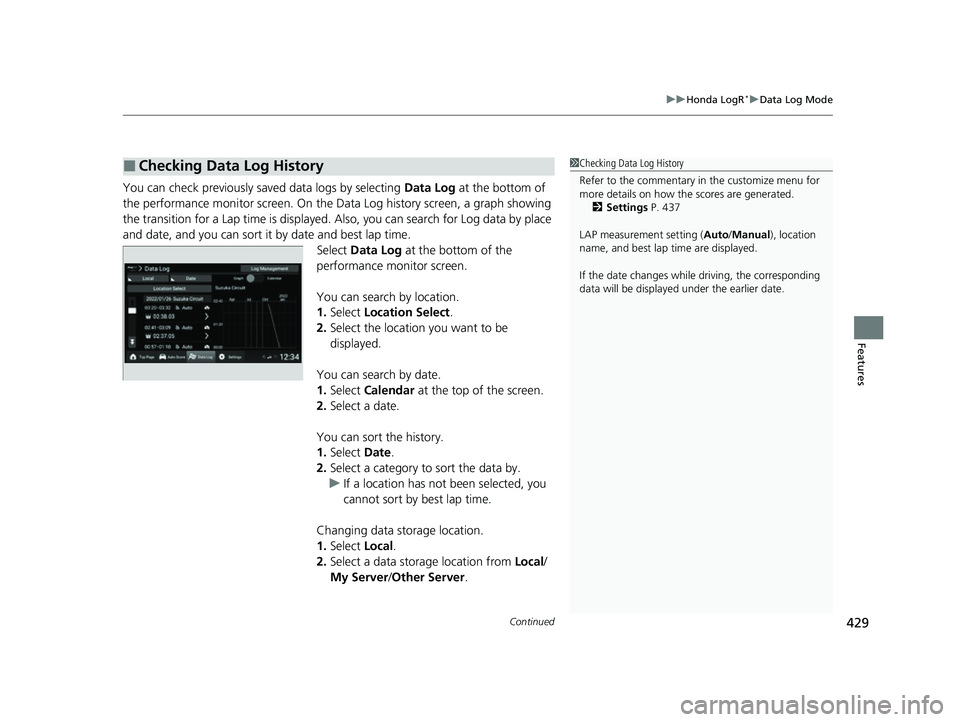
You can check previously saved data logs by selecting Data Log at the bottom of
the performance monitor screen. On the Da ta Log history screen, a graph showing
the transition for a Lap time is displayed. Also, you can search for Log data by place
and date, and you can sort it by date and best lap time. Select Data Log at the bottom of the
performance monitor screen.
You can search by location.
1. Select Location Select .
2. Select the location you want to be
displayed.
You can search by date.
1. Select Calendar at the top of the screen.
2. Select a date.
You can sort the history.
1. Select Date.
2. Select a category to sort the data by.
u If a location has not been selected, you
cannot sort by best lap time.
Changing data storage location.
1. Select Local.
2. Select a data storage location from Local/
My Server /Other Server.
■Checking Data Log History1 Checking Data Log History
Refer to the commentary in the customize menu for
more details on how the scores are generated.
2 Settings P. 437
LAP measurement setting ( Auto/Manual), location
name, and best lap time are displayed.
If the date changes whil e driving, the corresponding
data will be displaye d under the earlier date.
23 CIVIC HATCHBACK TYPE R-31T406100_03.book 429 ページ 2022年6月23日 木曜日 午後9時28分
Page 432 of 840
uuHonda LogR*uData Log Mode
430
Features
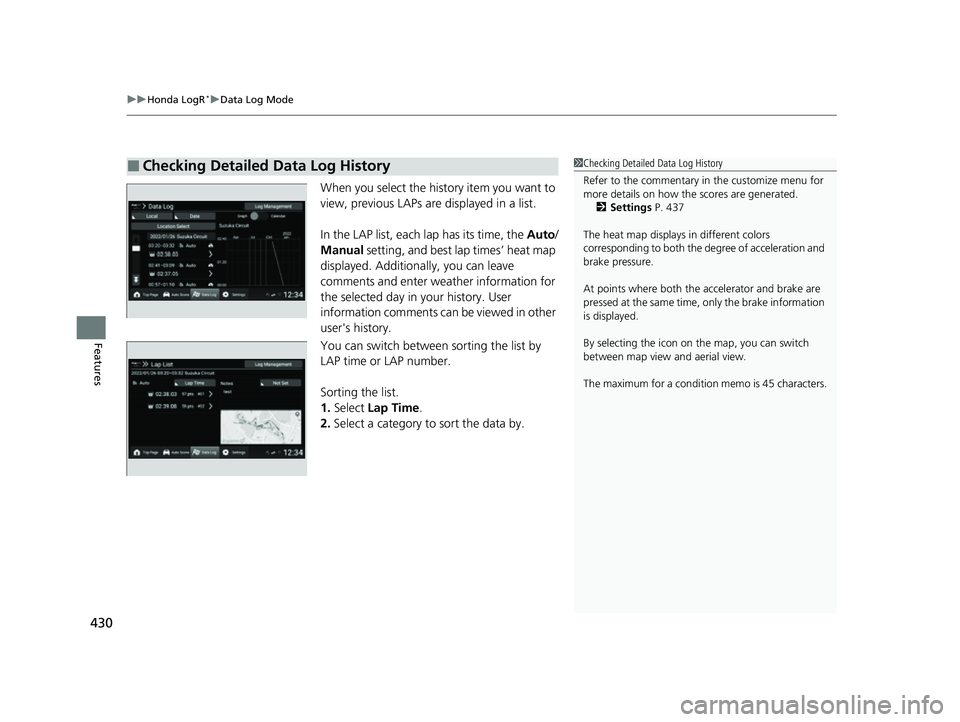
When you select the history item you want to
view, previous LAPs ar e displayed in a list.
In the LAP list, each lap has its time, the Auto/
Manual setting, and best lap times’ heat map
displayed. Additionally, you can leave
comments and enter weather information for
the selected day in your history. User
information comments can be viewed in other
user's history.
You can switch between sorting the list by
LAP time or LAP number.
Sorting the list.
1. Select Lap Time .
2. Select a category to sort the data by.
■Checking Detailed Data Log History1Checking Detailed Data Log History
Refer to the commentary in the customize menu for
more details on how the scores are generated.
2 Settings P. 437
The heat map displays in different colors
corresponding to both the de gree of acceleration and
brake pressure.
At points where both the ac celerator and brake are
pressed at the same time, only the brake information
is displayed.
By selecting the icon on the map, you can switch
between map view and aerial view.
The maximum for a condition memo is 45 characters.
23 CIVIC HATCHBACK TYPE R-31T406100_03.book 430 ページ 2022年6月23日 木曜日 午後9時28分
Page 433 of 840
Continued431
uuHonda LogR*uData Log Mode
Features
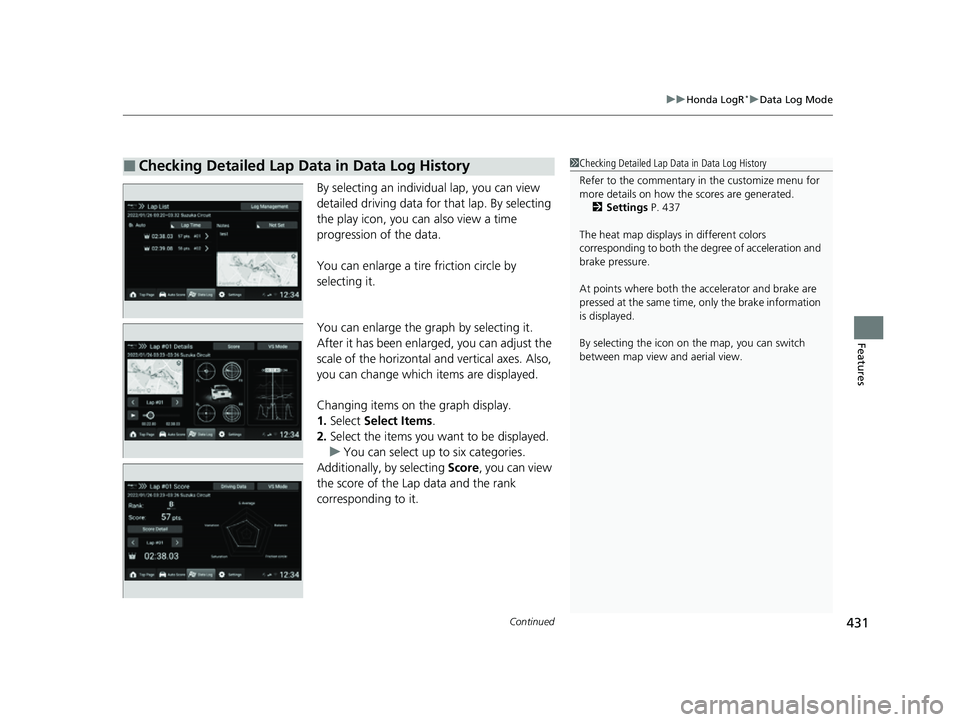
By selecting an individual lap, you can view
detailed driving data for that lap. By selecting
the play icon, you ca n also view a time
progression of the data.
You can enlarge a tire friction circle by
selecting it.
You can enlarge the graph by selecting it.
After it has been enlarged, you can adjust the
scale of the horizontal and vertical axes. Also,
you can change which items are displayed.
Changing items on the graph display.
1. Select Select Items .
2. Select the items you want to be displayed.
u You can select up to six categories.
Additionally, by selecting Score, you can view
the score of the Lap data and the rank
corresponding to it.
■Checking Detailed Lap Data in Data Log History1 Checking Detailed Lap Data in Data Log History
Refer to the commentary in the customize menu for
more details on how the scores are generated.
2 Settings P. 437
The heat map displays in different colors
corresponding to both the degree of acceleration and
brake pressure.
At points where both the ac celerator and brake are
pressed at the same time, only the brake information
is displayed.
By selecting the icon on the map, you can switch
between map view and aerial view.
23 CIVIC HATCHBACK TYPE R-31T406100_03.book 431 ページ 2022年6月23日 木曜日 午後9時28分
Page 435 of 840
Continued433
uuHonda LogR*uData Log Mode
Features
1. Select Log Management .
2. Select the LAP you want to delete.
3. Select Delete .
u By selecting Delete, the selected LAP can
be deleted from the Log. Also, you can
select whether to save as new Log data,
or to overwrite the data with the LAP
removed.
■Deleting Lap Data from the Data Log History1 Deleting Lap Data from the Data Log History
The heat map displays in different colors
corresponding to both the degree of acceleration and
brake pressure.
At points where both the ac celerator and brake are
pressed at the same time, only the brake information
is displayed.
If the data is saved to My Server or Other Server,
Log Management will not be displayed.
23 CIVIC HATCHBACK TYPE R-31T406100_03.book 433 ページ 2022年6月23日 木曜日 午後9時28分