2013 NISSAN GT-R warning
[x] Cancel search: warningPage 261 of 315
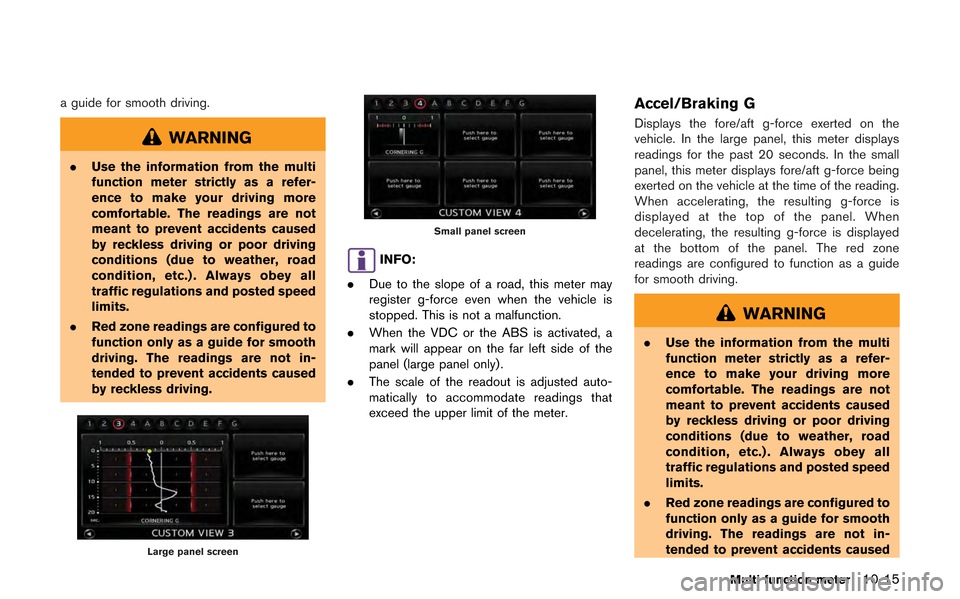
a guide for smooth driving.
WARNING
.Use the information from the multi
function meter strictly as a refer-
ence to make your driving more
comfortable. The readings are not
meant to prevent accidents caused
by reckless driving or poor driving
conditions (due to weather, road
condition, etc.) . Always obey all
traffic regulations and posted speed
limits.
. Red zone readings are configured to
function only as a guide for smooth
driving. The readings are not in-
tended to prevent accidents caused
by reckless driving.
Large panel screen
Small panel screen
INFO:
. Due to the slope of a road, this meter may
register g-force even when the vehicle is
stopped. This is not a malfunction.
. When the VDC or the ABS is activated, a
mark will appear on the far left side of the
panel (large panel only) .
. The scale of the readout is adjusted auto-
matically to accommodate readings that
exceed the upper limit of the meter.
Accel/Braking G
Displays the fore/aft g-force exerted on the
vehicle. In the large panel, this meter displays
readings for the past 20 seconds. In the small
panel, this meter displays fore/aft g-force being
exerted on the vehicle at the time of the reading.
When accelerating, the resulting g-force is
displayed at the top of the panel. When
decelerating, the resulting g-force is displayed
at the bottom of the panel. The red zone
readings are configured to function as a guide
for smooth driving.
WARNING
.Use the information from the multi
function meter strictly as a refer-
ence to make your driving more
comfortable. The readings are not
meant to prevent accidents caused
by reckless driving or poor driving
conditions (due to weather, road
condition, etc.) . Always obey all
traffic regulations and posted speed
limits.
. Red zone readings are configured to
function only as a guide for smooth
driving. The readings are not in-
tended to prevent accidents caused
Multi function meter10-15
Page 262 of 315
10-16Multi function meter
by reckless driving.
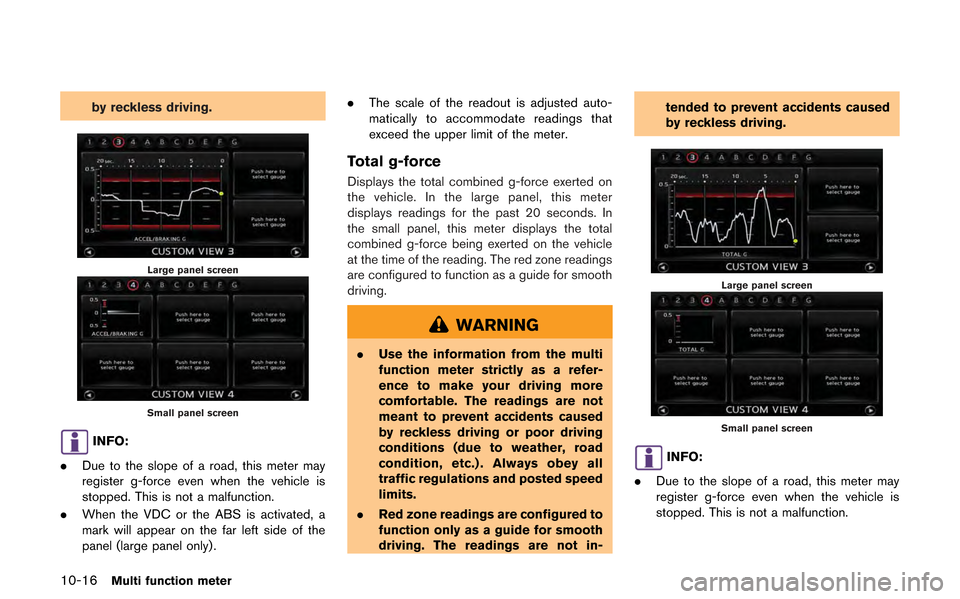
Large panel screen
Small panel screen
INFO:
. Due to the slope of a road, this meter may
register g-force even when the vehicle is
stopped. This is not a malfunction.
. When the VDC or the ABS is activated, a
mark will appear on the far left side of the
panel (large panel only) . .
The scale of the readout is adjusted auto-
matically to accommodate readings that
exceed the upper limit of the meter.
Total g-force
Displays the total combined g-force exerted on
the vehicle. In the large panel, this meter
displays readings for the past 20 seconds. In
the small panel, this meter displays the total
combined g-force being exerted on the vehicle
at the time of the reading. The red zone readings
are configured to function as a guide for smooth
driving.
WARNING
.Use the information from the multi
function meter strictly as a refer-
ence to make your driving more
comfortable. The readings are not
meant to prevent accidents caused
by reckless driving or poor driving
conditions (due to weather, road
condition, etc.) . Always obey all
traffic regulations and posted speed
limits.
. Red zone readings are configured to
function only as a guide for smooth
driving. The readings are not in- tended to prevent accidents caused
by reckless driving.
Large panel screen
Small panel screen
INFO:
. Due to the slope of a road, this meter may
register g-force even when the vehicle is
stopped. This is not a malfunction.
Page 263 of 315
.When the VDC or the ABS is activated, a
mark will appear on the far left side of the
panel (large panel only) .
. The scale of the readout is adjusted auto-
matically to accommodate readings that
exceed the upper limit of the meter.
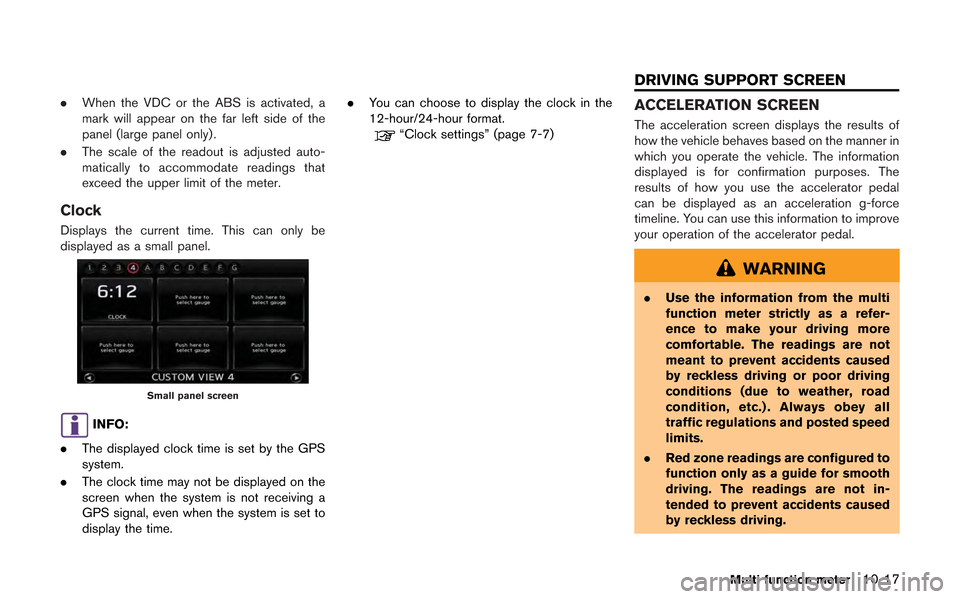
Clock
Displays the current time. This can only be
displayed as a small panel.
Small panel screen
INFO:
. The displayed clock time is set by the GPS
system.
. The clock time may not be displayed on the
screen when the system is not receiving a
GPS signal, even when the system is set to
display the time. .
You can choose to display the clock in the
12-hour/24-hour format.
“Clock settings” (page 7-7)
ACCELERATION SCREEN
The acceleration screen displays the results of
how the vehicle behaves based on the manner in
which you operate the vehicle. The information
displayed is for confirmation purposes. The
results of how you use the accelerator pedal
can be displayed as an acceleration g-force
timeline. You can use this information to improve
your operation of the accelerator pedal.
WARNING
. Use the information from the multi
function meter strictly as a refer-
ence to make your driving more
comfortable. The readings are not
meant to prevent accidents caused
by reckless driving or poor driving
conditions (due to weather, road
condition, etc.) . Always obey all
traffic regulations and posted speed
limits.
. Red zone readings are configured to
function only as a guide for smooth
driving. The readings are not in-
tended to prevent accidents caused
by reckless driving.
Multi function meter10-17
DRIVING SUPPORT SCREEN
Page 265 of 315
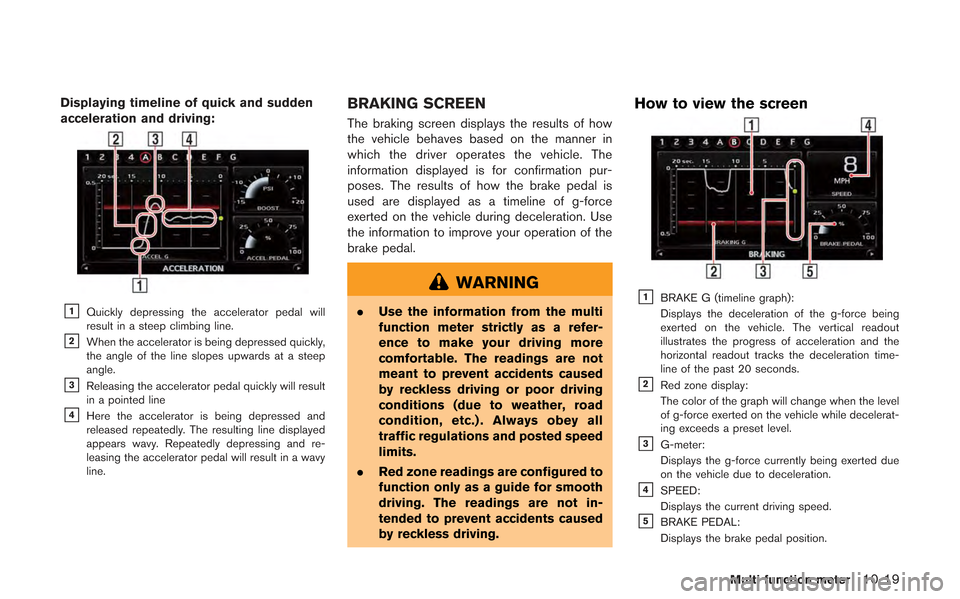
Displaying timeline of quick and sudden
acceleration and driving:
&1Quickly depressing the accelerator pedal will
result in a steep climbing line.
&2When the accelerator is being depressed quickly,
the angle of the line slopes upwards at a steep
angle.
&3Releasing the accelerator pedal quickly will result
in a pointed line
&4Here the accelerator is being depressed and
released repeatedly. The resulting line displayed
appears wavy. Repeatedly depressing and re-
leasing the accelerator pedal will result in a wavy
line.
BRAKING SCREEN
The braking screen displays the results of how
the vehicle behaves based on the manner in
which the driver operates the vehicle. The
information displayed is for confirmation pur-
poses. The results of how the brake pedal is
used are displayed as a timeline of g-force
exerted on the vehicle during deceleration. Use
the information to improve your operation of the
brake pedal.
WARNING
.Use the information from the multi
function meter strictly as a refer-
ence to make your driving more
comfortable. The readings are not
meant to prevent accidents caused
by reckless driving or poor driving
conditions (due to weather, road
condition, etc.) . Always obey all
traffic regulations and posted speed
limits.
. Red zone readings are configured to
function only as a guide for smooth
driving. The readings are not in-
tended to prevent accidents caused
by reckless driving.
How to view the screen
&1BRAKE G (timeline graph):
Displays the deceleration of the g-force being
exerted on the vehicle. The vertical readout
illustrates the progress of acceleration and the
horizontal readout tracks the deceleration time-
line of the past 20 seconds.
&2Red zone display:
The color of the graph will change when the level
of g-force exerted on the vehicle while decelerat-
ing exceeds a preset level.
&3G-meter:
Displays the g-force currently being exerted due
on the vehicle due to deceleration.
&4SPEED:
Displays the current driving speed.
&5BRAKE PEDAL:
Displays the brake pedal position.
Multi function meter10-19
Page 267 of 315
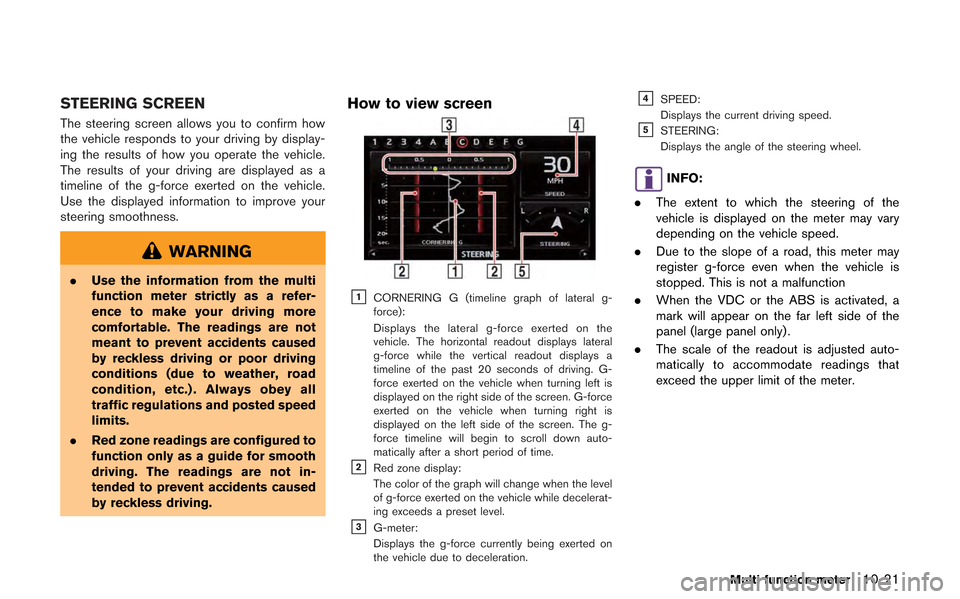
STEERING SCREEN
The steering screen allows you to confirm how
the vehicle responds to your driving by display-
ing the results of how you operate the vehicle.
The results of your driving are displayed as a
timeline of the g-force exerted on the vehicle.
Use the displayed information to improve your
steering smoothness.
WARNING
.Use the information from the multi
function meter strictly as a refer-
ence to make your driving more
comfortable. The readings are not
meant to prevent accidents caused
by reckless driving or poor driving
conditions (due to weather, road
condition, etc.) . Always obey all
traffic regulations and posted speed
limits.
. Red zone readings are configured to
function only as a guide for smooth
driving. The readings are not in-
tended to prevent accidents caused
by reckless driving.
How to view screen
&1CORNERING G (timeline graph of lateral g-
force):
Displays the lateral g-force exerted on the
vehicle. The horizontal readout displays lateral
g-force while the vertical readout displays a
timeline of the past 20 seconds of driving. G-
force exerted on the vehicle when turning left is
displayed on the right side of the screen. G-force
exerted on the vehicle when turning right is
displayed on the left side of the screen. The g-
force timeline will begin to scroll down auto-
matically after a short period of time.
&2Red zone display:
The color of the graph will change when the level
of g-force exerted on the vehicle while decelerat-
ing exceeds a preset level.
&3G-meter:
Displays the g-force currently being exerted on
the vehicle due to deceleration.
&4SPEED:
Displays the current driving speed.
&5STEERING:
Displays the angle of the steering wheel.
INFO:
. The extent to which the steering of the
vehicle is displayed on the meter may vary
depending on the vehicle speed.
. Due to the slope of a road, this meter may
register g-force even when the vehicle is
stopped. This is not a malfunction
. When the VDC or the ABS is activated, a
mark will appear on the far left side of the
panel (large panel only) .
. The scale of the readout is adjusted auto-
matically to accommodate readings that
exceed the upper limit of the meter.
Multi function meter10-21
Page 274 of 315
![NISSAN GT-R 2013 R35 Multi Function Display Owners Manual 10-28Multi function meter
2. Select the record you would like to display.The menu screen will be displayed.
3. Select [Delete Stop Watch Times]. Themessage screen will be displayed.
4. Select [YES]. T NISSAN GT-R 2013 R35 Multi Function Display Owners Manual 10-28Multi function meter
2. Select the record you would like to display.The menu screen will be displayed.
3. Select [Delete Stop Watch Times]. Themessage screen will be displayed.
4. Select [YES]. T](/manual-img/5/316/w960_316-273.png)
10-28Multi function meter
2. Select the record you would like to display.The menu screen will be displayed.
3. Select [Delete Stop Watch Times]. Themessage screen will be displayed.
4. Select [YES]. The time record will bedeleted.
INFO:
. You cannot recover deleted records.
. To delete all records select [Delete All Stop
Watch Times].
DRIVER’S NOTES SCREEN
You can record the waypoints that you pass
using the DRIVER’S NOTES screen.
How to view screen
&1MARK LIST (waypoint list):
Displays a list of waypoints saved automatically or
manually.
&2Timer indicator:
Flashes while the timer is operating.
&3FUEL/RANGE:
Displays the amount of fuel and the distance the
vehicle can travel on the remaining fuel
&4TRIP DISTANCE:
Displays the driving time measured starting from
when the Driver’s notes function was activated.
NOTICE
Even when the cruising distance dis-
plays that the vehicle has a sufficient
amount of fuel to travel a given dis-
tance, when the fuel indicator ap-
proaches E (empty) , or the fuel
warning light illuminates, be sure to
fuel your vehicle.
Timing waypoints
To measure a waypoint, use
or
Page 291 of 315
may be encountered between the system
and your actual location. Road system and
weather changes may affect the accuracy of
the information provided. Rely on your
common sense to decide whether to follow
a specified route. Detailed coverage is not
available in every city or roadway.HOW TO ORDER MAP DATA UP-
DATES
To order updated map data, contact the
NISSAN NAVIGATION SYSTEM HELPDESK.
See the contact information on the inside front
cover of this manual.
ABOUT MAP DATA
1. This map data has been prepared byHITACHI, LTD. under licence from ZENRIN
CO., LTD. and NAVTEQ. ZENRIN CO., LTD.
has added, processed and digitized data
based on the digital road map data of
Navigation Technologies Corporation. Due
to the production timing of the map data,
some new roads may not be included in this
map data or some of the names or roads
may be different from those at the time you
use this map data.
2. Traffic control and regulation data used in this map data may be different from those at
the time you use this map data due to the
data production timing. When driving your
vehicle, follow the actual traffic control signs
and notices on the roads.
3. Reproducing or copying this map software is strictly prohibited by law.
Published by Nissan North America, Inc.
*C2006 Navigation Technologies. All rights
reserved.
Certain business data provided by infoUSA, Inc.,
Omaha, NE, Copyright
*C1993-2008 NAVTEQ. All Rights Reserved.
*C2008, All Rights Reserved.
*CZENRIN CO., LTD. 2009. All rights reserved.
*CZENRIN USA, INC. 2008. All rights reserved.
*C2008 Zagat Survey, LLC.
WARNING
. This navigation system should not
be used to replace your own judge-
ment. No itinerary suggested by this
navigation system should ever over-
ride any highway regulations, your
own judgement, or a knowledge of
safe driving practices. Do not follow
the navigation system’s suggested
itinerary if it would cause you to
perform a dangerous or illegal act,
place you in a dangerous situation,
or take you into an area you con-
sider unsafe.
General system information11-13
MAP DATA
Page 293 of 315
tion taken with permission from Canadian
authorities, including:*CHer Majesty the Queen
in Right of Canada,*CQueen’s Printer for
Ontario,*CCanada Post Corporation, Geo-
Base®.
NAVTEQ holds a non-exclusive license from the
United States Postal Service
®to publish and
sell ZIP+4®information.
*CUnited States Postal Service®2008. Prices
are not established, controlled or approved by
the United States Postal Service
®. The following
trademarks and registrations are owned by the
USPS: United States Postal Service, USPS, and
ZIP+4.
Terms and conditions
Personal Use Only. You agree to use this Data
together with Nissan Automotive Products for
the solely personal, non-commercial purposes
for which you were licensed, and not for service
bureau, timesharing or other similar purposes.
Accordingly, but subject to the restrictions set
forth in the following paragraphs, you may copy
this Data only as necessary for your personal
use to (i) view it, and (ii) save it, provided that
you do not remove any copyright notices that
appear and do not modify the Data in any way.
You agree not to otherwise reproduce, copy,
modify, decompile, disassemble or reverse engineer any portion of this Data, and may not
transfer or distribute it in any form, for any
purpose, except to the extent permitted by
mandatory laws. Multi-disc sets may only be
transferred or sold as a complete set as
provided by HITACHI and not as a subset
thereof.
Restrictions.
Except where you have been
specifically licensed to do so by HITACHI, and
without limiting the preceding paragraph, you
may not (a) use this Data with any products,
systems, or applications installed or otherwise
connected to or in communication with vehicles,
capable of vehicle navigation, positioning, dis-
patch, real time route guidance, fleet manage-
ment or similar applications; or (b) with or in
communication with any positioning devices or
any mobile or wireless-connected electronic or
computer devices, including without limitation
cellular phones, palmtop and handheld compu-
ters, pagers, and personal digital assistants or
PDAs.
Warning. The Data may contain inaccurate or
incomplete information due to the passage of
time, changing circumstances, sources used
and the nature of collecting comprehensive
geographic data, any of which may lead to
incorrect results.
No Warranty. This Data is provided to you “as is,” and you agree to use it at your own risk.
HITACHI and its licensors (and their licensors
and suppliers) make no guarantees, representa-
tions or warranties of any kind, express or
implied, arising by law or otherwise, including
but not limited to, content, quality, accuracy,
completeness, effectiveness, reliability, fitness
for a particular purpose, usefulness, use or
results to be obtained from this Data, or that the
Data or server will be uninterrupted or error-free.
Disclaimer of Warranty:
HITACHI AND ITS
LICENSORS (INCLUDING THEIR LICENSORS
AND SUPPLIERS) DISCLAIM ANY WARRAN-
TIES, EXPRESS OR IMPLIED, OF QUALITY,
PERFORMANCE, MERCHANTABILITY, FIT-
NESS FOR A PARTICULAR PURPOSE OR
NONINFRINGEMENT. Some States, Territories
and Countries do not allow certain warranty
exclusions, so to that extent the above exclusion
may not apply to you.
Disclaimer of Liability: HITACHI AND ITS
LICENSORS (INCLUDING THEIR LICENSORS
AND SUPPLIERS) SHALL NOT BE LIABLE TO
YOU: IN RESPECT OF ANY CLAIM, DEMAND
OR ACTION, IRRESPECTIVE OF THE NATURE
OF THE CAUSE OF THE CLAIM, DEMAND OR
ACTION ALLEGING ANY LOSS, INJURY OR
DAMAGES, DIRECT OR INDIRECT, WHICH
MAY RESULT FROM THE USE OR POSSES-
General system information11-15