2013 NISSAN GT-R change time
[x] Cancel search: change timePage 244 of 315
9-6Monitor system
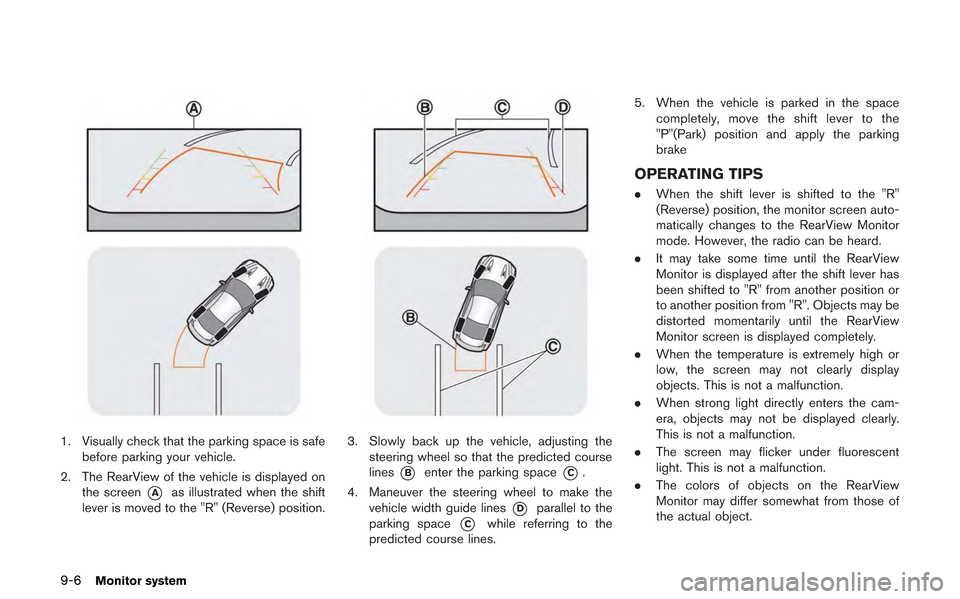
1. Visually check that the parking space is safebefore parking your vehicle.
2. The RearView of the vehicle is displayed on the screen
*Aas illustrated when the shift
lever is moved to the "R" (Reverse) position.
3. Slowly back up the vehicle, adjusting the steering wheel so that the predicted course
lines
*Benter the parking space*C.
4. Maneuver the steering wheel to make the vehicle width guide lines
*Dparallel to the
parking space
*Cwhile referring to the
predicted course lines. 5. When the vehicle is parked in the space
completely, move the shift lever to the
"P"(Park) position and apply the parking
brake
OPERATING TIPS
. When the shift lever is shifted to the "R"
(Reverse) position, the monitor screen auto-
matically changes to the RearView Monitor
mode. However, the radio can be heard.
. It may take some time until the RearView
Monitor is displayed after the shift lever has
been shifted to "R" from another position or
to another position from "R". Objects may be
distorted momentarily until the RearView
Monitor screen is displayed completely.
. When the temperature is extremely high or
low, the screen may not clearly display
objects. This is not a malfunction.
. When strong light directly enters the cam-
era, objects may not be displayed clearly.
This is not a malfunction.
. The screen may flicker under fluorescent
light. This is not a malfunction.
. The colors of objects on the RearView
Monitor may differ somewhat from those of
the actual object.
Page 257 of 315
Large panel screen
Small panel screen
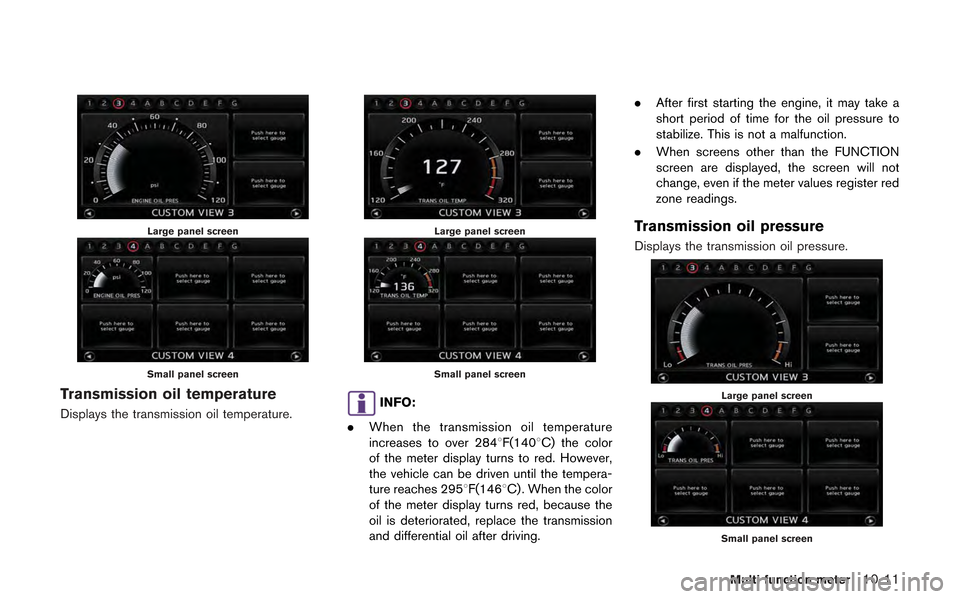
Transmission oil temperature
Displays the transmission oil temperature.
Large panel screen
Small panel screen
INFO:
. When the transmission oil temperature
increases to over 2848F(1408C) the color
of the meter display turns to red. However,
the vehicle can be driven until the tempera-
ture reaches 2958F(1468C) . When the color
of the meter display turns red, because the
oil is deteriorated, replace the transmission
and differential oil after driving. .
After first starting the engine, it may take a
short period of time for the oil pressure to
stabilize. This is not a malfunction.
. When screens other than the FUNCTION
screen are displayed, the screen will not
change, even if the meter values register red
zone readings.
Transmission oil pressure
Displays the transmission oil pressure.
Large panel screen
Small panel screen
Multi function meter10-11
Page 264 of 315
10-18Multi function meter
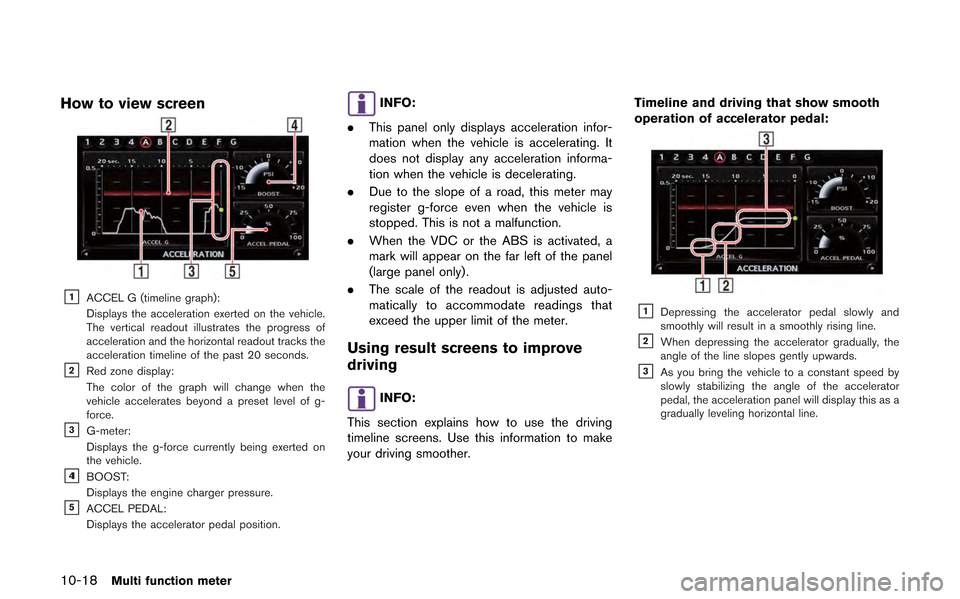
How to view screen
&1ACCEL G (timeline graph):
Displays the acceleration exerted on the vehicle.
The vertical readout illustrates the progress of
acceleration and the horizontal readout tracks the
acceleration timeline of the past 20 seconds.
&2Red zone display:
The color of the graph will change when the
vehicle accelerates beyond a preset level of g-
force.
&3G-meter:
Displays the g-force currently being exerted on
the vehicle.
&41BOOST:
Displays the engine charger pressure.
&5ACCEL PEDAL:
Displays the accelerator pedal position.
INFO:
. This panel only displays acceleration infor-
mation when the vehicle is accelerating. It
does not display any acceleration informa-
tion when the vehicle is decelerating.
. Due to the slope of a road, this meter may
register g-force even when the vehicle is
stopped. This is not a malfunction.
. When the VDC or the ABS is activated, a
mark will appear on the far left of the panel
(large panel only).
. The scale of the readout is adjusted auto-
matically to accommodate readings that
exceed the upper limit of the meter.
Using result screens to improve
driving
INFO:
This section explains how to use the driving
timeline screens. Use this information to make
your driving smoother. Timeline and driving that show smooth
operation of accelerator pedal:
&1Depressing the accelerator pedal slowly and
smoothly will result in a smoothly rising line.
&2When depressing the accelerator gradually, the
angle of the line slopes gently upwards.
&3As you bring the vehicle to a constant speed by
slowly stabilizing the angle of the accelerator
pedal, the acceleration panel will display this as a
gradually leveling horizontal line.
Page 265 of 315
Displaying timeline of quick and sudden
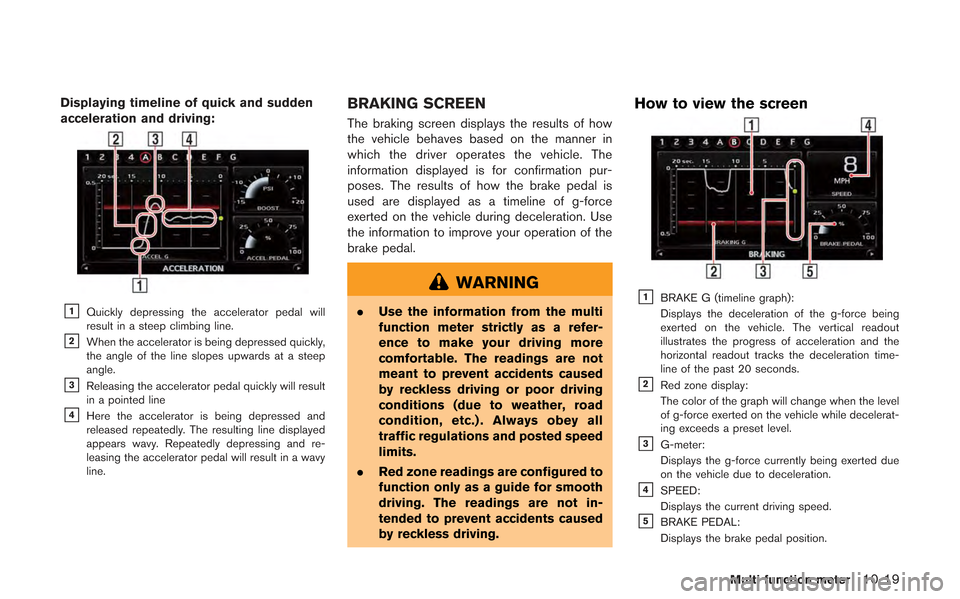
acceleration and driving:
&1Quickly depressing the accelerator pedal will
result in a steep climbing line.
&2When the accelerator is being depressed quickly,
the angle of the line slopes upwards at a steep
angle.
&3Releasing the accelerator pedal quickly will result
in a pointed line
&4Here the accelerator is being depressed and
released repeatedly. The resulting line displayed
appears wavy. Repeatedly depressing and re-
leasing the accelerator pedal will result in a wavy
line.
BRAKING SCREEN
The braking screen displays the results of how
the vehicle behaves based on the manner in
which the driver operates the vehicle. The
information displayed is for confirmation pur-
poses. The results of how the brake pedal is
used are displayed as a timeline of g-force
exerted on the vehicle during deceleration. Use
the information to improve your operation of the
brake pedal.
WARNING
.Use the information from the multi
function meter strictly as a refer-
ence to make your driving more
comfortable. The readings are not
meant to prevent accidents caused
by reckless driving or poor driving
conditions (due to weather, road
condition, etc.) . Always obey all
traffic regulations and posted speed
limits.
. Red zone readings are configured to
function only as a guide for smooth
driving. The readings are not in-
tended to prevent accidents caused
by reckless driving.
How to view the screen
&1BRAKE G (timeline graph):
Displays the deceleration of the g-force being
exerted on the vehicle. The vertical readout
illustrates the progress of acceleration and the
horizontal readout tracks the deceleration time-
line of the past 20 seconds.
&2Red zone display:
The color of the graph will change when the level
of g-force exerted on the vehicle while decelerat-
ing exceeds a preset level.
&3G-meter:
Displays the g-force currently being exerted due
on the vehicle due to deceleration.
&4SPEED:
Displays the current driving speed.
&5BRAKE PEDAL:
Displays the brake pedal position.
Multi function meter10-19
Page 267 of 315
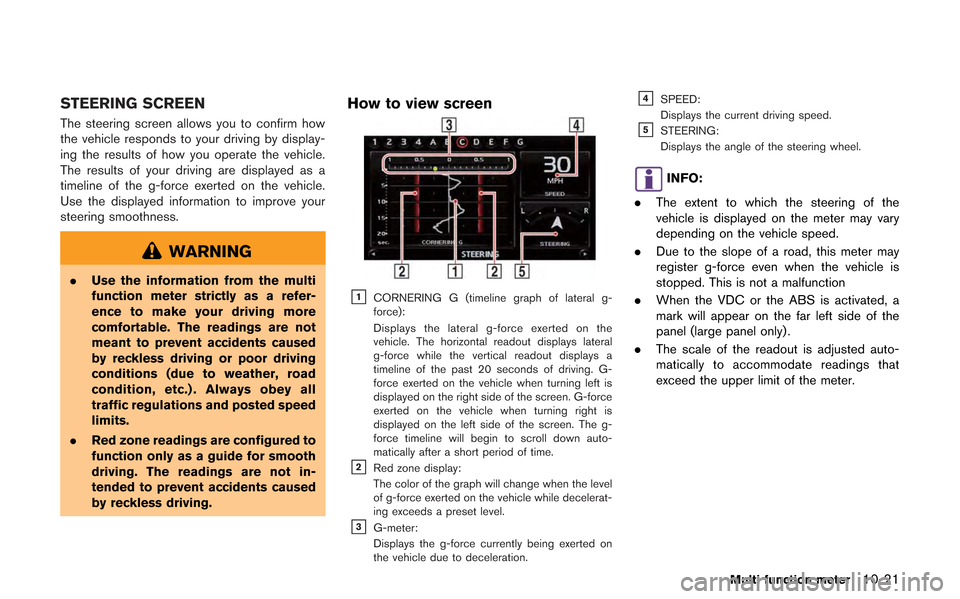
STEERING SCREEN
The steering screen allows you to confirm how
the vehicle responds to your driving by display-
ing the results of how you operate the vehicle.
The results of your driving are displayed as a
timeline of the g-force exerted on the vehicle.
Use the displayed information to improve your
steering smoothness.
WARNING
.Use the information from the multi
function meter strictly as a refer-
ence to make your driving more
comfortable. The readings are not
meant to prevent accidents caused
by reckless driving or poor driving
conditions (due to weather, road
condition, etc.) . Always obey all
traffic regulations and posted speed
limits.
. Red zone readings are configured to
function only as a guide for smooth
driving. The readings are not in-
tended to prevent accidents caused
by reckless driving.
How to view screen
&1CORNERING G (timeline graph of lateral g-
force):
Displays the lateral g-force exerted on the
vehicle. The horizontal readout displays lateral
g-force while the vertical readout displays a
timeline of the past 20 seconds of driving. G-
force exerted on the vehicle when turning left is
displayed on the right side of the screen. G-force
exerted on the vehicle when turning right is
displayed on the left side of the screen. The g-
force timeline will begin to scroll down auto-
matically after a short period of time.
&2Red zone display:
The color of the graph will change when the level
of g-force exerted on the vehicle while decelerat-
ing exceeds a preset level.
&3G-meter:
Displays the g-force currently being exerted on
the vehicle due to deceleration.
&4SPEED:
Displays the current driving speed.
&5STEERING:
Displays the angle of the steering wheel.
INFO:
. The extent to which the steering of the
vehicle is displayed on the meter may vary
depending on the vehicle speed.
. Due to the slope of a road, this meter may
register g-force even when the vehicle is
stopped. This is not a malfunction
. When the VDC or the ABS is activated, a
mark will appear on the far left side of the
panel (large panel only) .
. The scale of the readout is adjusted auto-
matically to accommodate readings that
exceed the upper limit of the meter.
Multi function meter10-21
Page 268 of 315
10-22Multi function meter
Using result screens to improve
driving
This section explains how to use the driving
timeline screens. Use this information to make
your driving smoother.
INFO:
The criteria for smooth driving may vary depend-
ing on road conditions. Use this information for
reference purposes only.
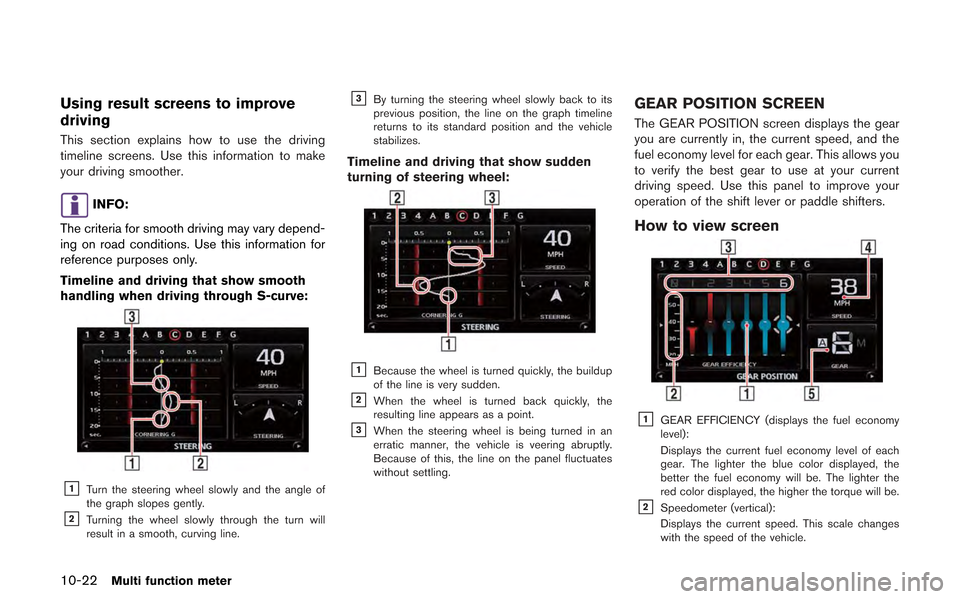
Timeline and driving that show smooth
handling when driving through S-curve:
&1Turn the steering wheel slowly and the angle of
the graph slopes gently.
&2Turning the wheel slowly through the turn will
result in a smooth, curving line.
&3By turning the steering wheel slowly back to its
previous position, the line on the graph timeline
returns to its standard position and the vehicle
stabilizes.
Timeline and driving that show sudden
turning of steering wheel:
&1Because the wheel is turned quickly, the buildup
of the line is very sudden.
&2When the wheel is turned back quickly, the
resulting line appears as a point.
&3When the steering wheel is being turned in an
erratic manner, the vehicle is veering abruptly.
Because of this, the line on the panel fluctuates
without settling.
GEAR POSITION SCREEN
The GEAR POSITION screen displays the gear
you are currently in, the current speed, and the
fuel economy level for each gear. This allows you
to verify the best gear to use at your current
driving speed. Use this panel to improve your
operation of the shift lever or paddle shifters.
How to view screen
&1GEAR EFFICIENCY (displays the fuel economy
level):
Displays the current fuel economy level of each
gear. The lighter the blue color displayed, the
better the fuel economy will be. The lighter the
red color displayed, the higher the torque will be.
&2Speedometer (vertical):
Displays the current speed. This scale changes
with the speed of the vehicle.
Page 269 of 315
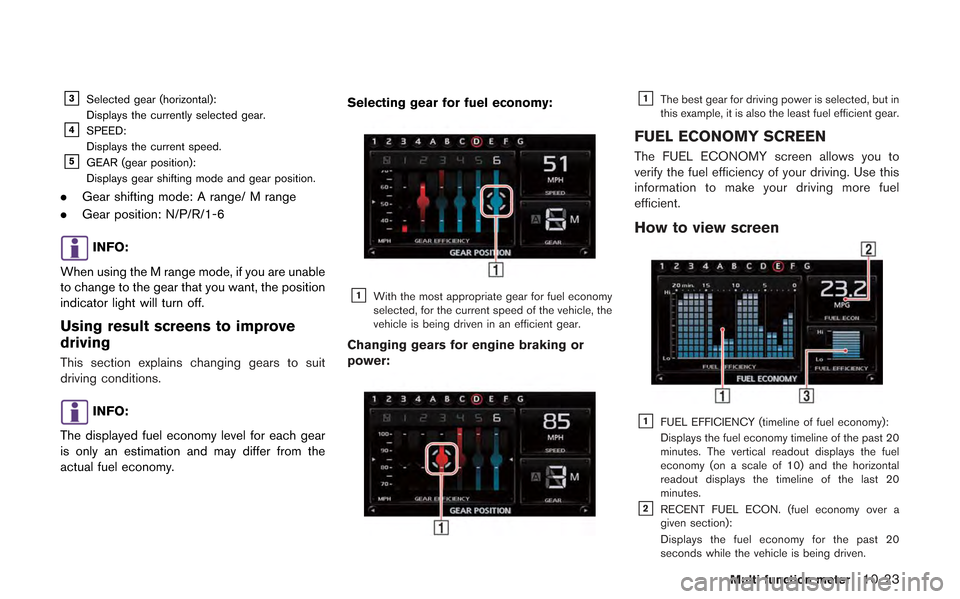
&3Selected gear (horizontal):
Displays the currently selected gear.
&4SPEED:
Displays the current speed.
&5GEAR (gear position):
Displays gear shifting mode and gear position.
.Gear shifting mode: A range/ M range
. Gear position: N/P/R/1-6
INFO:
When using the M range mode, if you are unable
to change to the gear that you want, the position
indicator light will turn off.
Using result screens to improve
driving
This section explains changing gears to suit
driving conditions.
INFO:
The displayed fuel economy level for each gear
is only an estimation and may differ from the
actual fuel economy. Selecting gear for fuel economy:
&1With the most appropriate gear for fuel economy
selected, for the current speed of the vehicle, the
vehicle is being driven in an efficient gear.
Changing gears for engine braking or
power:
&1The best gear for driving power is selected, but in
this example, it is also the least fuel efficient gear.
FUEL ECONOMY SCREEN
The FUEL ECONOMY screen allows you to
verify the fuel efficiency of your driving. Use this
information to make your driving more fuel
efficient.
How to view screen
&1FUEL EFFICIENCY (timeline of fuel economy):
Displays the fuel economy timeline of the past 20
minutes. The vertical readout displays the fuel
economy (on a scale of 10) and the horizontal
readout displays the timeline of the last 20
minutes.
&2RECENT FUEL ECON. (fuel economy over a
given section):
Displays the fuel economy for the past 20
seconds while the vehicle is being driven.
Multi function meter10-23
Page 273 of 315
![NISSAN GT-R 2013 R35 Multi Function Display Owners Manual 1. Insert the USB memory in the media slot.
2. Select [TIME LOG]. The list screen will bedisplayed.
3. Select the record you would like to display.The menu screen will be displayed.
4. Select [Transfe NISSAN GT-R 2013 R35 Multi Function Display Owners Manual 1. Insert the USB memory in the media slot.
2. Select [TIME LOG]. The list screen will bedisplayed.
3. Select the record you would like to display.The menu screen will be displayed.
4. Select [Transfe](/manual-img/5/316/w960_316-272.png)
1. Insert the USB memory in the media slot.
2. Select [TIME LOG]. The list screen will bedisplayed.
3. Select the record you would like to display.The menu screen will be displayed.
4. Select [Transfer Stop Watch Times to USB
Memory]. The time record is saved to the
USB memory.
NOTICE
Inserting objects other than a USB
memory into the USB connector can
cause damage. Do not insert anything
other than a USB memory into the USB
connector.
INFO:
. Time records are saved to the USB memory
in the CSV format.
. While records are being saved to the USB
memory, do not change the key position or
remove the USB memory. .
To save all records to the USB memory,
select [Transfer All Stop Watch Times to
USB Mem.].
Deleting records
Use the following procedure to delete time
records saved in the system.
1. Select [TIME LOG]. The list screen will be
displayed.
Multi function meter10-27