Page 185 of 514
3-96 Features and controls
3
Audio (For vehicles with AM/FM electronically
tuned radio with CD autochanger)
N00533400100
This display shows the condition of the audio. For instruction
on how to use the audio, refer to “Audio system” on page 5-30.NOTE�If an audio system adjustment is made when an indication
other than that for the audio is shown, the display gives
the audio indication momentarily then returns to previous
display.
Trip computer
N00500200010
The trip computer shows driving information and environmen-
tal information. It can also be used as a stopwatch and as a
timer.Change of trip computer display
N00500400025
Every time the “NEXT” function button is pressed lightly, the
display can be changed.
Combined display → Average speed → Average fuel economy
→ Stopwatch → Countdown timer → Elevation/Barometer →
Outside temperature
BK0102600US.book 96 ページ 2009年3月30日 月曜日 午後2時2分
Page 187 of 514
 that can be
driven on the fuel remaining in the fuel tank.NOTE�If the driving range drops below 3")
3-98 Features and controls
3
Driving range
N00500700028
This value shows the distance (in miles or km) that can be
driven on the fuel remaining in the fuel tank.NOTE�If the driving range drops below 30 miles (50 km) while
the driving range is displayed, the display shows “--”.
When this occurs, replenish the fuel tank as soon as possi-
ble.
�When the system cannot provide a definite value for the
driving range, the display shows “---”.
�The driving range varies depending on road conditions,
the manner of driving and other related factors. Conse-
quently, the display should be used only as a guide. It is
recommended to add fuel as soon as the low-fuel warning
light in the instrument cluster illuminates.
(Refer to “Low-fuel warning light” on page 3-80.)
�Refueling will update the driving range indication.
�The driving range displayed is based on previous fuel
economy data. Disconnecting the battery cable will result
in the deletion of existing fuel consumption data, which
will affect the unit’s calculations.
�The driving range figure can occasionally increase if the
vehicle is stopped on an incline. This is normal, as the fuel
has moved in the tank because of the incline.
Average speed
N00500800029
The average speed (B) from the time when the display was last
reset to the present moment is shown with a graph. For instruc-
tions on resetting the display, refer to “To reset the display” on
page 3-105.NOTE�The range (A) for which historical data are shown in the
graph can be changed. Refer to “Graph indication” on
page 3-106.
�The unit for the average speed can be set to mph or km/h.
Refer to “Display unit selection” on page 3-106 or “Units
customization” on page 3-120.
�When the system cannot provide a definite value for aver-
age speed, it is displayed as “--”.
BK0102600US.book 98 ページ 2009年3月30日 月曜日 午後2時2分
Page 188 of 514

Features and controls
3-99
3
�When the ignition switch is turned on, the average speed
which was being displayed when the ignition switch was
previously turned off will be displayed once again. Average fuel economy
N00500900033
The average fuel economy (B) from the time when the display
was last reset to the present moment is shown together with a
graph. For instructions on resetting the display, refer to “To
reset the display” on page 3-105.NOTE�The range (A) for which historical data are shown in the
graph can be changed. Refer to “Graph indication” on
page 3-106.
�The unit for the average fuel economy can be set to mpg
or L/100 km. Refer to “Display unit selection” on page
3-106 or “Units customization” on page 3-120.�When the system cannot provide a definite value for aver-
age fuel economy, it is displayed as “--.-”.
�When the ignition switch is turned on, the average fuel
economy which was being displayed when the ignition
switch was previously turned off will be displayed once
again.
�Average fuel economy varies according to the conditions
under which a vehicle is travelling (road conditions, the
manner in which the vehicle is being driven, etc.).
Actual fuel economy may differ from the displayed aver-
age fuel economy.
BK0102600US.book 99 ページ 2009年3月30日 月曜日 午後2時2分
Page 190 of 514
Features and controls
3-101
3
Countdown timer
N00501200020
It is possible to set a duration (up to 24 hours) and then view
the remaining time as the timer counts down to zero.
1. Press the “SET” function button to view the timer setting
display.2. Press the “SELECT” function button to put the cursor on
the item (hours/minutes) you wish to set.
Then use the “ ” function button to set your desired
time. Pressing “ ” function button for more than 2 sec-
onds will fast forward to the desired change.
Press the “SET” function button to finish setting the timer
duration. The display will return to its previous display.
NOTE�The timer duration cannot be set in units of seconds.
BK0102600US.book 101 ページ 2009年3月30日 月曜日 午後2時2分
Page 191 of 514

3-102 Features and controls
3
3. Press the “START” function button to start the timer. To
stop the timer before it has reached 0:00:00, press the
“STOP” function button.NOTE�If the timer reaches 0:00:00 while another display is
showing, a tone sounds once and the display changes to
the countdown timer for seven seconds.
If the “DISP” function button is pressed at this time, the
countdown timer disappears and the previous display
appears again.
�When the countdown timer has started, the “START”
function button becomes the “STOP” function button.
�Even if the ignition switch is turned to the “OFF” position
while the countdown timer is running, the countdown
timer continues counting down to 0:00:00.�Normally, a tone sounds to indicate that the countdown
timer has reached 0:00:00. It is possible to make a setting
so that the tone does not sound at this time. For details,
refer to “Timer buzzer setting” on page 3-126.
4. To reset the countdown timer, press the “SET” function
button for at least 2 seconds. The display will return to
0:00:00.
NOTE�Even if the “SET” function button is pressed while the
countdown timer is running, the countdown timer will not
be reset.
�If the “SET” function button is pressed lightly one time,
the previously set timer duration will be shown. To
change the timer duration setting, perform the procedure
again from step 1.
BK0102600US.book 102 ページ 2009年3月30日 月曜日 午後2時2分
Page 192 of 514
 of the vehicle’s present location and a
barometer (C) are shown together with a graph. For instruc-
tions on resettin")
Features and controls
3-103
3
Elevation/Barometer
N00501300063
The elevation (A) of the vehicle’s present location and a
barometer (C) are shown together with a graph. For instruc-
tions on resetting the historical data in the graph, refer to “To
reset the display” on page 3-105.
NOTE�The range (B) for which historical data are shown in the
graph can be changed. Refer to “Graph indication” on
page 3-106.
�The unit for elevation can be set to feet or meters. Refer to
“Display unit selection” on page 3-106 or “Units customi-
zation” on page 3-120.
�The display can show elevations up to 12,000 feet (4,000
meters).
�The altimeter displays the elevation to the nearest 200 feet
(50 meters). When the vehicle is below sea level, the ele-
vation is shown as 0 feet (0 meters).
�The unit for the atmospheric pressure can be set to in.Hg,
hPa, kPa, or mb.
Refer to “Units customization” on page 3-120.
�The display can show the atmospheric pressure in the
range from 18.1 in.Hg (614 hPa) to 31.2 in.Hg
(1,058 hPa).
�The altimeter works by using changes in atmospheric
pressure. This means it may be affected by changes in the
weather and other conditions, and show a figure different
from the real elevation.
�Fluctuations in air pressure may change the figure dis-
played even when the vehicle remains in the same place.
This is normal.
BK0102600US.book 103 ページ 2009年3月30日 月曜日 午後2時2分
Page 194 of 514
Features and controls
3-105
3
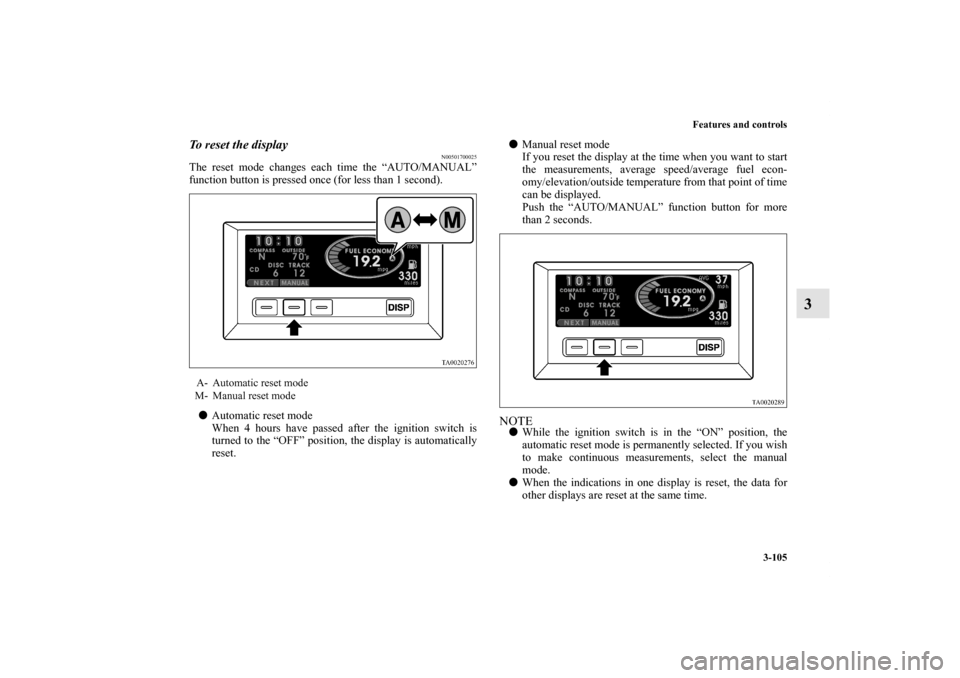
To reset the display
N00501700025
The reset mode changes each time the “AUTO/MANUAL”
function button is pressed once (for less than 1 second).
�Automatic reset mode
When 4 hours have passed after the ignition switch is
turned to the “OFF” position, the display is automatically
reset.�Manual reset mode
If you reset the display at the time when you want to start
the measurements, average speed/average fuel econ-
omy/elevation/outside temperature from that point of time
can be displayed.
Push the “AUTO/MANUAL” function button for more
than 2 seconds.
NOTE�While the ignition switch is in the “ON” position, the
automatic reset mode is permanently selected. If you wish
to make continuous measurements, select the manual
mode.
�When the indications in one display is reset, the data for
other displays are reset at the same time.
A- Automatic reset mode
M- Manual reset mode
BK0102600US.book 105 ページ 2009年3月30日 月曜日 午後2時2分
Page 195 of 514

3-106 Features and controls
3
Graph indication
N00501800039
The average speed, average fuel economy, elevation, and out-
side temperature are each shown as a graph at the same time as
being shown numerically.
The range for which historical data are shown in the graphs
changes each time the “RANGE” function button is pressed
lightly.
�-3 hours: The average value is added to the graph every 6
minutes. Data for a maximum of three hours are shown in
the graph.
�-12 hours: The average value is added to the graph every
24 minutes. Data for a maximum of twelve hours are
shown in the graph.
NOTE�When the range for which historical data are shown is
changed for one graph, it also changes for the other
graphs.Display unit selection
N00501900027
When you want to select the other unit, pressing the function
button (A) for more than 3 seconds changes the unit as follows.
Mode
Unit
Driving range miles
→km
→milesAverage speed mph
→km/h
→mph
Average fuel economy mpg
→L/100km
→mpg
Elevation feet (ft)
→m
→feet (ft)
BK0102600US.book 106 ページ 2009年3月30日 月曜日 午後2時2分

N00533400100
This display shows the condition of the audio. For instruction
on how to use t")
 and then view
the remaining time as the timer counts down to zero.
1. Press the “SET” f")