Page 2245 of 6020

ENGINE DRIVEABILITY AND EMISSIONS 6E–75
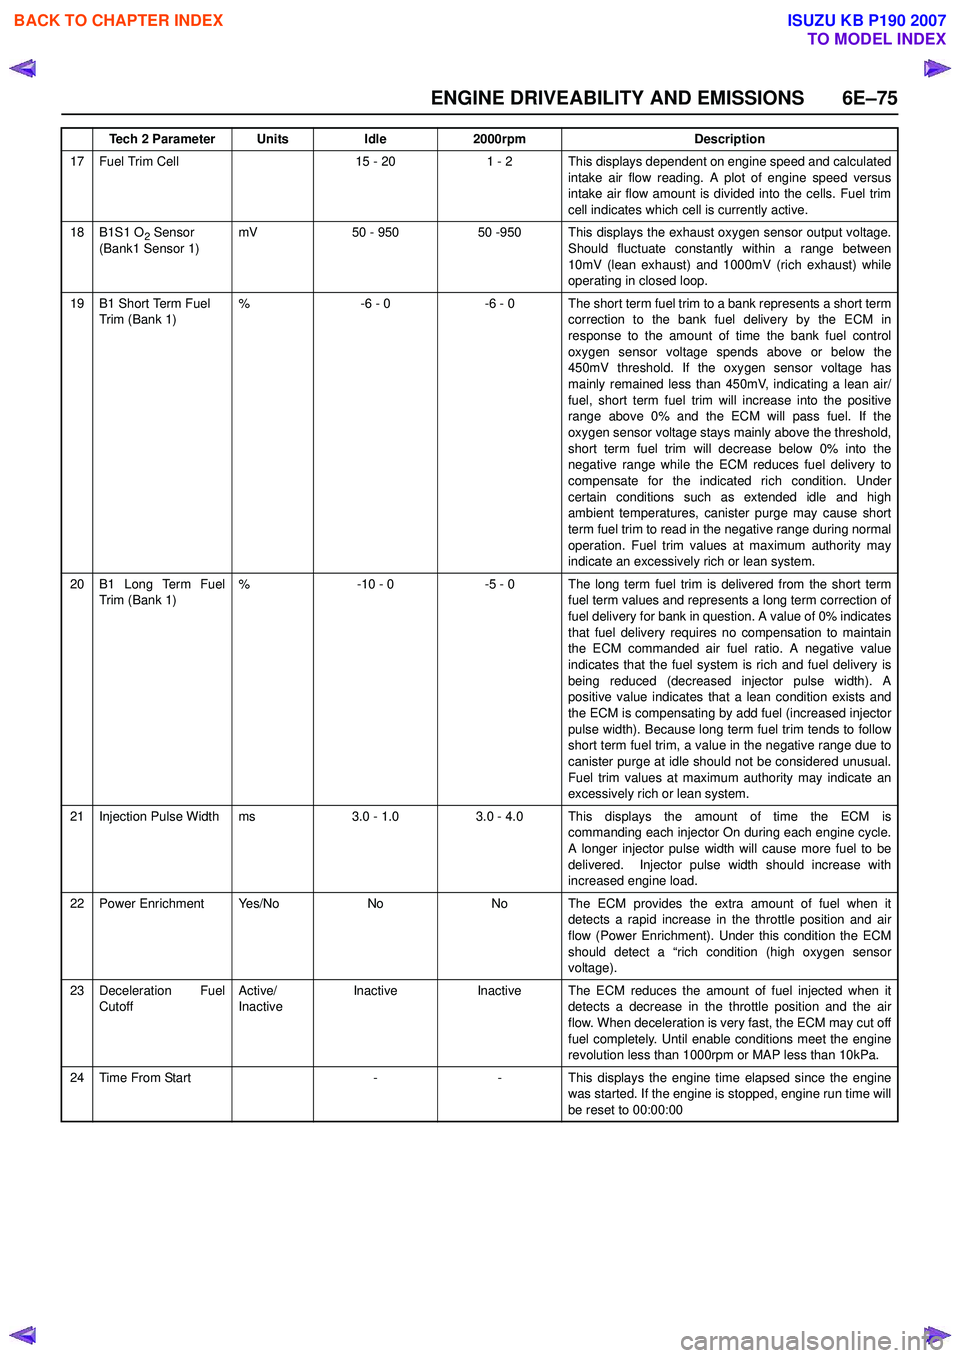
17 Fuel Trim Cell15 - 201 - 2 This displays dependent on engine speed and calculatedintake air flow reading. A plot of engine speed versus
intake air flow amount is divided into the cells. Fuel trim
cell indicates which cell is currently active.
18B1S1 O2 Sensor
(Bank1 Sensor 1)mV50 - 95050 -950 This displays the exhaust oxygen sensor output voltage. Should fluctuate constantly within a range between
10mV (lean exhaust) and 1000mV (rich exhaust) while
operating in closed loop.
19B1 Short Term Fuel
Trim (Bank 1)%-6 - 0-6 - 0 The short term fuel trim to a bank represents a short term correction to the bank fuel delivery by the ECM in
response to the amount of time the bank fuel control
oxygen sensor voltage spends above or below the
450mV threshold. If the oxygen sensor voltage has
mainly remained less than 450mV, indicating a lean air/
fuel, short term fuel trim will increase into the positive
range above 0% and the ECM will pass fuel. If the
oxygen sensor voltage stays mainly above the threshold,
short term fuel trim will decrease below 0% into the
negative range while the ECM reduces fuel delivery to
compensate for the indicated rich condition. Under
certain conditions such as extended idle and high
ambient temperatures, canister purge may cause short
term fuel trim to read in the negative range during normal
operation. Fuel trim values at maximum authority may
indicate an excessively rich or lean system.
20B1 Long Term Fuel
Trim (Bank 1)%-10 - 0-5 - 0 The long term fuel trim is delivered from the short term fuel term values and represents a long term correction of
fuel delivery for bank in question. A value of 0% indicates
that fuel delivery requires no compensation to maintain
the ECM commanded air fuel ratio. A negative value
indicates that the fuel system is rich and fuel delivery is
being reduced (decreased injector pulse width). A
positive value indicates that a lean condition exists and
the ECM is compensating by add fuel (increased injector
pulse width). Because long term fuel trim tends to follow
short term fuel trim, a value in the negative range due to
canister purge at idle should not be considered unusual.
Fuel trim values at maximum authority may indicate an
excessively rich or lean system.
21Injection Pulse Widthms3.0 - 1.03.0 - 4.0 This displays the amount of time the ECM is commanding each injector On during each engine cycle.
A longer injector pulse width will cause more fuel to be
delivered. Injector pulse width should increase with
increased engine load.
22Power EnrichmentYe s / N oNoNo The ECM provides the extra amount of fuel when it detects a rapid increase in the throttle position and air
flow (Power Enrichment). Under this condition the ECM
should detect a “rich condition (high oxygen sensor
voltage).
23Deceleration Fuel
Cutoff Active/
InactiveInactiveInactiveThe ECM reduces the amount of fuel injected when it
detects a decrease in the throttle position and the air
flow. When deceleration is very fast, the ECM may cut off
fuel completely. Until enable conditions meet the engine
revolution less than 1000rpm or MAP less than 10kPa.
24Time From Start--This displays the engine time elapsed since the engine
was started. If the engine is stopped, engine run time will
be reset to 00:00:00
Tech 2 ParameterUnitsIdle2000rpmDescription
BACK TO CHAPTER INDEX
TO MODEL INDEX
ISUZU KB P190 2007
Page 2246 of 6020

6E–76 ENGINE DRIVEABILITY AND EMISSIONS
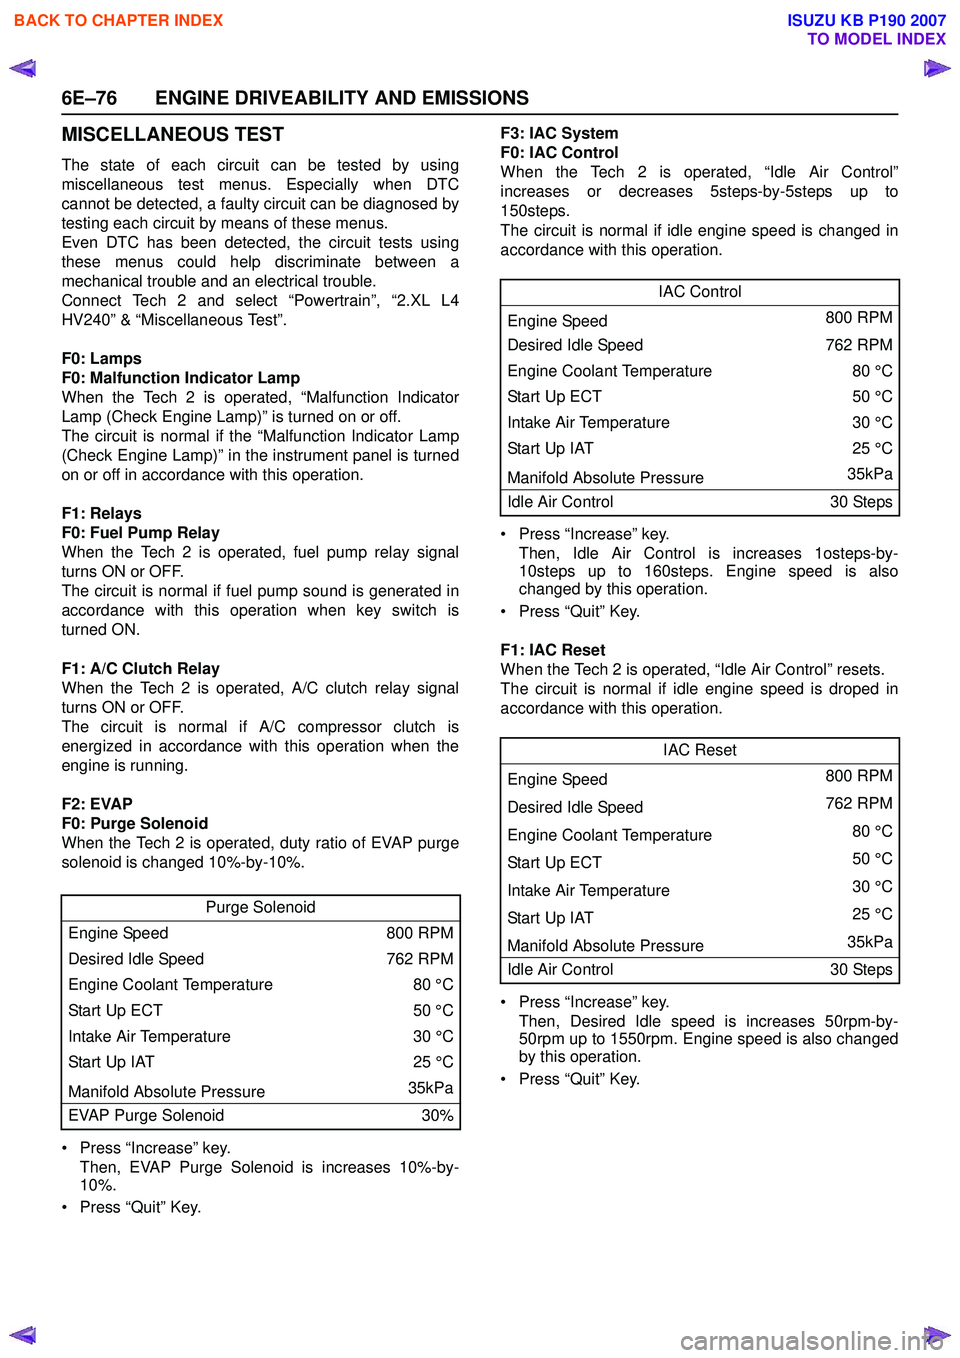
MISCELLANEOUS TEST
The state of each circuit can be tested by using
miscellaneous test menus. Especially when DTC
cannot be detected, a faulty circuit can be diagnosed by
testing each circuit by means of these menus.
Even DTC has been detected, the circuit tests using
these menus could help discriminate between a
mechanical trouble and an electrical trouble.
Connect Tech 2 and select “Powertrain”, “2.XL L4
HV240” & “Miscellaneous Test”.
F0: Lamps
F0: Malfunction Indicator Lamp
When the Tech 2 is operated, “Malfunction Indicator
Lamp (Check Engine Lamp)” is turned on or off.
The circuit is normal if the “Malfunction Indicator Lamp
(Check Engine Lamp)” in the instrument panel is turned
on or off in accordance with this operation.
F1: Relays
F0: Fuel Pump Relay
When the Tech 2 is operated, fuel pump relay signal
turns ON or OFF.
The circuit is normal if fuel pump sound is generated in
accordance with this operation when key switch is
turned ON.
F1: A/C Clutch Relay
When the Tech 2 is operated, A/C clutch relay signal
turns ON or OFF.
The circuit is normal if A/C compressor clutch is
energized in accordance with this operation when the
engine is running.
F2: EVAP
F0: Purge Solenoid
When the Tech 2 is operated, duty ratio of EVAP purge
solenoid is changed 10%-by-10%.
• Press “Increase” key. Then, EVAP Purge Solenoid is increases 10%-by-
10%.
• Press “Quit” Key. F3: IAC System
F0: IAC Control
When the Tech 2 is operated, “Idle Air Control”
increases or decreases 5steps-by-5steps up to
150steps.
The circuit is normal if idle engine speed is changed in
accordance with this operation.
• Press “Increase” key. Then, Idle Air Control is increases 1osteps-by-
10steps up to 160steps. Engine speed is also
changed by this operation.
• Press “Quit” Key.
F1: IAC Reset
When the Tech 2 is operated, “Idle Air Control” resets.
The circuit is normal if idle engine speed is droped in
accordance with this operation.
• Press “Increase” key. Then, Desired Idle speed is increases 50rpm-by-
50rpm up to 1550rpm. Engine speed is also changed
by this operation.
• Press “Quit” Key.
Purge Solenoid
Engine Speed 800 RPM
Desired Idle Speed 762 RPM
Engine Coolant Temperature 80 °C
Start Up ECT 50 °C
Intake Air Temperature 30 °C
Start Up IAT 25 °C
Manifold Absolute Pressure 35kPa
EVAP Purge Solenoid 30%
IAC Control
Engine Speed 800 RPM
Desired Idle Speed 762 RPM
Engine Coolant Temperature 80 °C
Sta rt U p E C T 50 °C
Intake Air Temperature 30 °C
Start Up IAT25 °C
Manifold Absolute Pressure 35kPa
Idle Air Control 30 Steps
IAC Reset
Engine Speed 800 RPM
Desired Idle Speed 762 RPM
Engine Coolant Temperature 80 °C
Sta rt U p E C T 50 °C
Intake Air Temperature 30 °C
Start Up IAT 25 °C
Manifold Absolute Pressure 35kPa
Idle Air Control 30 Steps
BACK TO CHAPTER INDEX
TO MODEL INDEX
ISUZU KB P190 2007
Page 2247 of 6020
ENGINE DRIVEABILITY AND EMISSIONS 6E–77
F4: Injector Balance Test
When the Tech 2 is operated, selected injector turns ON
or OFF.
The circuit is normal if engine vibration is changed at
selected cylinder in accordance with this operation
when engine is idling.
• Press “Injector Off” key. Then, engine speed drops and vibration occurs when
a cylinder is selected.
• Press “Quit” Key. Injector Balance Test
Engine Speed 800 RPM
Desired Idle Speed 762 RPM
Engine Coolant Temperature 80
Start Up ECT 50
Intake Air Temperature 30
Start Up IAT 25
Manifold Absolute Pressure 35kPa
Injector 1 On
BACK TO CHAPTER INDEX
TO MODEL INDEX
ISUZU KB P190 2007
Page 2248 of 6020
6E–78 ENGINE DRIVEABILITY AND EMISSIONS
PLOTTING SNAPSHOT GRAPH
This test selects several necessary items from the data
list to plot graphs and makes data comparison on a long
term basis. It is an effective test particularly in emission
related evaluations.
060RX037For trouble diagnosis, you can collect graphic data
(snap shot) directly from the vehicle.
You can replay the snapshot data as needed. Therefore,
accurate diagnosis is possible, even though the vehicle
is not available.
BACK TO CHAPTER INDEX
TO MODEL INDEX
ISUZU KB P190 2007
Page 2249 of 6020
ENGINE DRIVEABILITY AND EMISSIONS 6E–79
Plotting Graph Flow Chart (Plotting graph after obtaining vehicle information)
D06RY00167
BACK TO CHAPTER INDEX
TO MODEL INDEX
ISUZU KB P190 2007
Page 2250 of 6020
6E–80 ENGINE DRIVEABILITY AND EMISSIONS
Flow Chart for Snapshot Replay (Plotting Graph)
060RX0-40
BACK TO CHAPTER INDEX
TO MODEL INDEX
ISUZU KB P190 2007
Page 2251 of 6020
![ISUZU KB P190 2007 Workshop Repair Manual ENGINE DRIVEABILITY AND EMISSIONS 6E–81
SNAPSHOT DISPLAY WITH TIS2000
Procedures for transferring and displaying Tech2
snapshot data by using TIS2000 [Snapshot Upload]
function is described below.
ISUZU KB P190 2007 Workshop Repair Manual ENGINE DRIVEABILITY AND EMISSIONS 6E–81
SNAPSHOT DISPLAY WITH TIS2000
Procedures for transferring and displaying Tech2
snapshot data by using TIS2000 [Snapshot Upload]
function is described below.](/manual-img/61/57177/w960_57177-2250.png)
ENGINE DRIVEABILITY AND EMISSIONS 6E–81
SNAPSHOT DISPLAY WITH TIS2000
Procedures for transferring and displaying Tech2
snapshot data by using TIS2000 [Snapshot Upload]
function is described below.
Snapshot data can be displayed with [Snapshot Upload]
function included in TIS2000.
1. Record the snapshot data, in Tech2.
2. Transfer the snapshot data to PC. By analyzing these data in various methods, trouble
conditions can be checked.
Snapshot data is displayed by executing the three steps
below shown:
After recording the snapshot in Tech2, transfer the data
from Tech2 to PC by the below procedures.
1. Start TIS2000.
2. Select [Snapshot Upload] on the TIS2000 start screen.
3. Select [Upload from trouble diagnosis tool (transfer from diagnosis tester)] or click the corresponding
icon of the tool bar.
4. Select Tech2, and transfer the recorded snapshot information. 5. Select the transferred snapshot.
6. After ending transfer of the snapshot, data parameter list is displayed on the screen.
BACK TO CHAPTER INDEX
TO MODEL INDEX
ISUZU KB P190 2007
Page 2252 of 6020
![ISUZU KB P190 2007 Workshop Repair Manual 6E–82 ENGINE DRIVEABILITY AND EMISSIONS
3. Snapshot data is displayed with TIS2000[Snapshot Upload] function.
Snapshot is stored in the PC hard disk or floppy disk,
and can be displayed any time.
S ISUZU KB P190 2007 Workshop Repair Manual 6E–82 ENGINE DRIVEABILITY AND EMISSIONS
3. Snapshot data is displayed with TIS2000[Snapshot Upload] function.
Snapshot is stored in the PC hard disk or floppy disk,
and can be displayed any time.
S](/manual-img/61/57177/w960_57177-2251.png)
6E–82 ENGINE DRIVEABILITY AND EMISSIONS
3. Snapshot data is displayed with TIS2000[Snapshot Upload] function.
Snapshot is stored in the PC hard disk or floppy disk,
and can be displayed any time.
Stored snapshot can be displayed by the below
procedures.
1. Start TIS2000.
2. Select [Snapshot Upload] on the TIS2000 start screen. 3. Select [Open the existing files] or click the
corresponding icon of the tool bar.
4. Select the transferred snapshot.
5. Open the snapshot, to display the data parameter list on the screen.
Graph display Values and graphs (Max. 3 graphs):
1. Click the icon for graph display. [Graph Parameter]window opens.
2. Click the first graph icon of the window upper part, and select one parameter from the list of the window
lower part. Selected parameter is displayed nest to
the graph icon. Graph division can be selected in
the field on the parameter right side.
3. Repeat the same procedures with the 2nd and 3rd icons.
4. After selecting all parameters to be displayed (Max. 3 parameters), click [OK] button.
5. Parameter selected is displayed in graph form on the right of the data parameter on the screen. 6. Graph display can be moved with the navigation
icon.
7. For displaying another parameter by graph, click the parameter of the list, drug the mouse to the display
screen while pressing the mouse button and release
the mouse button. New parameter is displayed at
the position of the previous parameter. For
displaying the graph display screen in full size,
move the cursor upward on the screen. When the
cursor is changed to the magnifying glass form, click
the screen. Graph screen is displayed on the whole
screen.
BACK TO CHAPTER INDEX
TO MODEL INDEX
ISUZU KB P190 2007