Page 207 of 248

INFO:
. Due to the slope of a road, this meter may
register G-Force even when the vehicle is
stopped. This is not a malfunction.
. When the VDC or the ABS is activated, a
mark will appear on the far left side of the
panel (large panel only) .
. The scale of the readout is adjusted auto-
matically to accommodate readings that
exceed the upper limit of the meter.
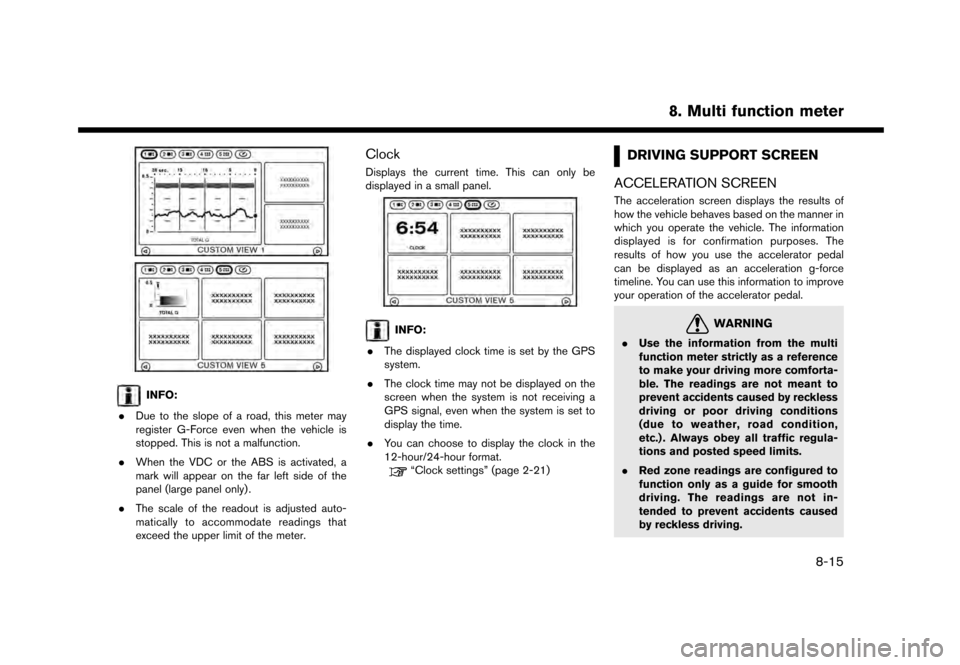
Clock
Displays the current time. This can only be
displayed in a small panel.
INFO:
. The displayed clock time is set by the GPS
system.
. The clock time may not be displayed on the
screen when the system is not receiving a
GPS signal, even when the system is set to
display the time.
. You can choose to display the clock in the
12-hour/24-hour format.
“Clock settings” (page 2-21)
DRIVING SUPPORT SCREEN
ACCELERATION SCREEN
The acceleration screen displays the results of
how the vehicle behaves based on the manner in
which you operate the vehicle. The information
displayed is for confirmation purposes. The
results of how you use the accelerator pedal
can be displayed as an acceleration g-force
timeline. You can use this information to improve
your operation of the accelerator pedal.
WARNING
. Use the information from the multi
function meter strictly as a reference
to make your driving more comforta-
ble. The readings are not meant to
prevent accidents caused by reckless
driving or poor driving conditions
(due to weather, road condition,
etc.) . Always obey all traffic regula-
tions and posted speed limits.
. Red zone readings are configured to
function only as a guide for smooth
driving. The readings are not in-
tended to prevent accidents caused
by reckless driving.
8. Multi function meter
8-15
Page 209 of 248

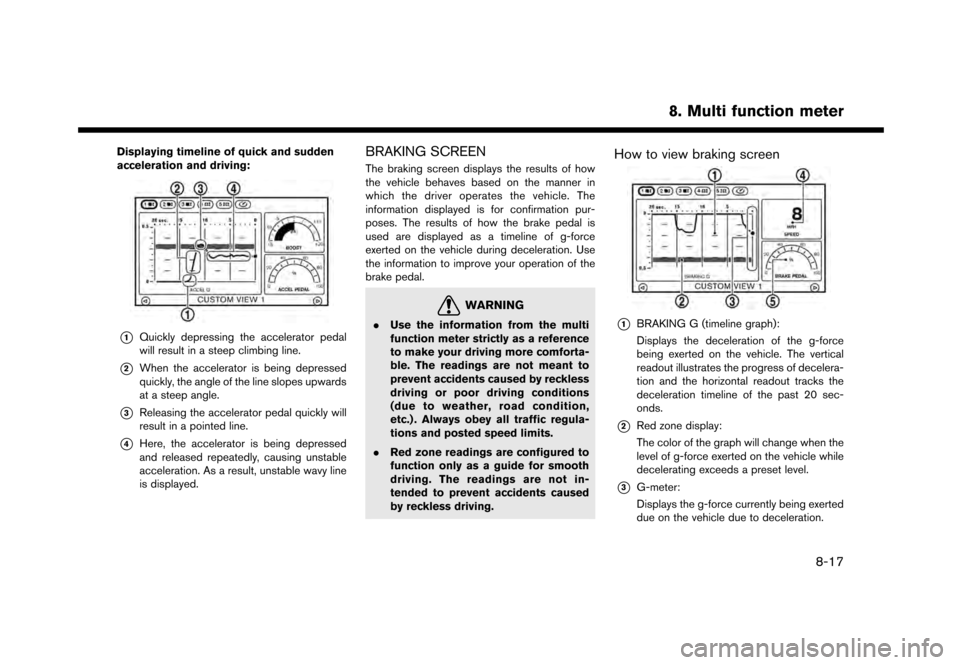
Displaying timeline of quick and sudden
acceleration and driving:
*1Quickly depressing the accelerator pedal
will result in a steep climbing line.
*2When the accelerator is being depressed
quickly, the angle of the line slopes upwards
at a steep angle.
*3Releasing the accelerator pedal quickly will
result in a pointed line.
*4Here, the accelerator is being depressed
and released repeatedly, causing unstable
acceleration. As a result, unstable wavy line
is displayed.
BRAKING SCREEN
The braking screen displays the results of how
the vehicle behaves based on the manner in
which the driver operates the vehicle. The
information displayed is for confirmation pur-
poses. The results of how the brake pedal is
used are displayed as a timeline of g-force
exerted on the vehicle during deceleration. Use
the information to improve your operation of the
brake pedal.
WARNING
.Use the information from the multi
function meter strictly as a reference
to make your driving more comforta-
ble. The readings are not meant to
prevent accidents caused by reckless
driving or poor driving conditions
(due to weather, road condition,
etc.) . Always obey all traffic regula-
tions and posted speed limits.
. Red zone readings are configured to
function only as a guide for smooth
driving. The readings are not in-
tended to prevent accidents caused
by reckless driving.
How to view braking screen
*1BRAKING G (timeline graph):
Displays the deceleration of the g-force
being exerted on the vehicle. The vertical
readout illustrates the progress of decelera-
tion and the horizontal readout tracks the
deceleration timeline of the past 20 sec-
onds.
*2Red zone display:
The color of the graph will change when the
level of g-force exerted on the vehicle while
decelerating exceeds a preset level.
*3G-meter:
Displays the g-force currently being exerted
due on the vehicle due to deceleration.
8. Multi function meter
8-17
Page 211 of 248

*4Because the brake pedal was depressed
quickly the vehicle stopped abruptly. The
graph becomes perpendicular to the time
scale.
STEERING SCREEN
The steering screen allows you to confirm how
the vehicle responds to your driving by displaying
the results of how you operate the vehicle. The
results of your driving are displayed as a timeline
of the g-force exerted on the vehicle. Use the
displayed information to improve your steering
smoothness.
WARNING
.Use the information from the multi
function meter strictly as a reference
to make your driving more comforta-
ble. The readings are not meant to
prevent accidents caused by reckless
driving or poor driving conditions
(due to weather, road condition,
etc.) . Always obey all traffic regula-
tions and posted speed limits.
. Red zone readings are configured to
function only as a guide for smooth
driving. The readings are not in-
tended to prevent accidents caused by reckless driving.
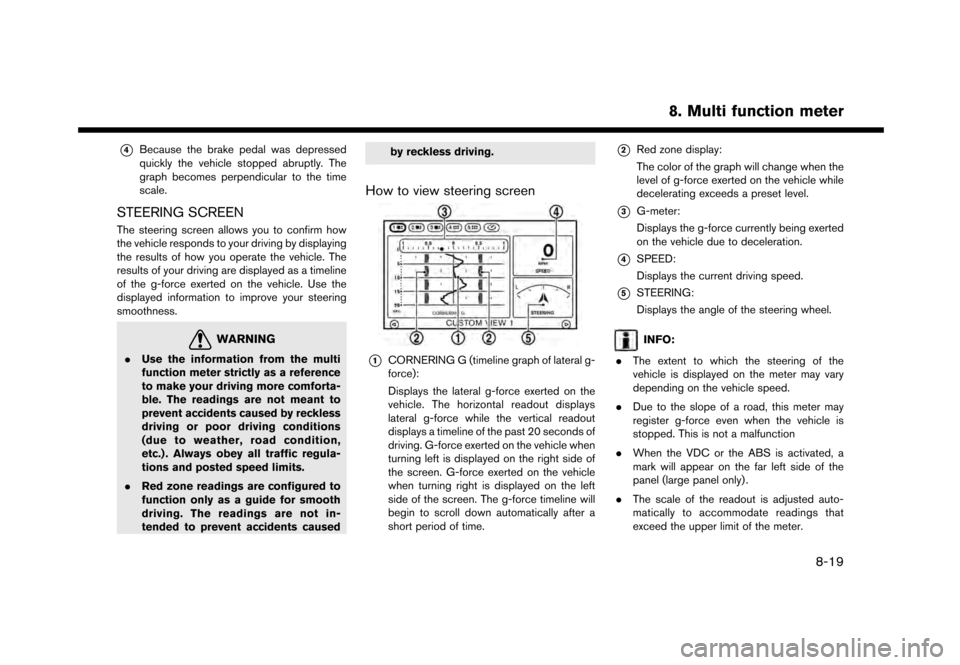
How to view steering screen
*1CORNERING G (timeline graph of lateral g-
force):
Displays the lateral g-force exerted on the
vehicle. The horizontal readout displays
lateral g-force while the vertical readout
displays a timeline of the past 20 seconds of
driving. G-force exerted on the vehicle when
turning left is displayed on the right side of
the screen. G-force exerted on the vehicle
when turning right is displayed on the left
side of the screen. The g-force timeline will
begin to scroll down automatically after a
short period of time.
*2Red zone display:
The color of the graph will change when the
level of g-force exerted on the vehicle while
decelerating exceeds a preset level.
*3G-meter:
Displays the g-force currently being exerted
on the vehicle due to deceleration.
*4SPEED:
Displays the current driving speed.
*5STEERING:
Displays the angle of the steering wheel.
INFO:
. The extent to which the steering of the
vehicle is displayed on the meter may vary
depending on the vehicle speed.
. Due to the slope of a road, this meter may
register g-force even when the vehicle is
stopped. This is not a malfunction
. When the VDC or the ABS is activated, a
mark will appear on the far left side of the
panel (large panel only) .
. The scale of the readout is adjusted auto-
matically to accommodate readings that
exceed the upper limit of the meter.
8. Multi function meter
8-19