Page 51 of 88

CAR menu
A new lap timer recording is started by
pr e
s
sing on the surface of the digital lap
timer + .
Statistics/close.
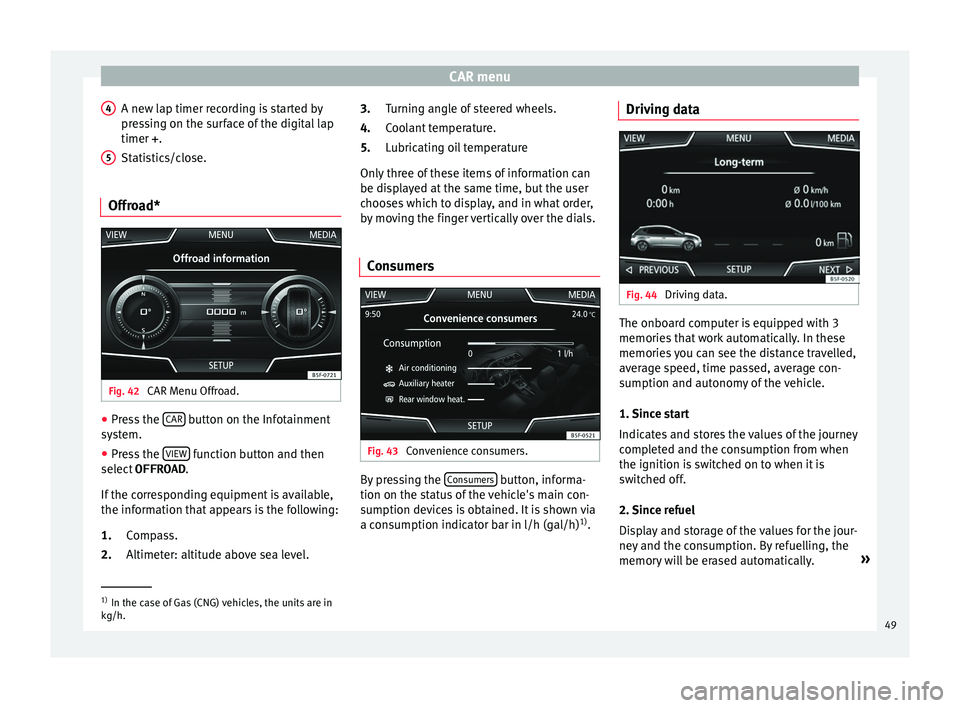
Offroad* Fig. 42
CAR Menu Offroad. ●
Press the CAR button on the Infotainment
sy s
t
em.
● Press the VIEW function button and then
sel ect
OFFROAD .
If
the corresponding equipment is available,
the information that appears is the following:
Compass.
Altimeter: altitude above sea level.
4 5
1.
2. Turning angle of steered wheels.
C
oo
l
ant temperature.
Lubricating oil temperature
Only three of these items of information can
be displayed at the same time, but the user
chooses which to display, and in what order,
by moving the finger vertically over the dials.
Consumers Fig. 43
Convenience consumers. By pressing the
C
on
s
umers button, informa-
tion on the s t
at
us of the vehicle's main con-
sumption devices is obtained. It is shown via
a consumption indicator bar in l/h (gal/h) 1)
.
3.
4.
5.
Driving data Fig. 44
Driving data. The onboard computer is equipped with 3
memorie
s
th
at work automatically. In these
memories you can see the distance travelled,
average speed, time passed, average con-
sumption and autonomy of the vehicle.
1. Since start
Indicates and stores the values of the journey
completed and the consumption from when
the ignition is switched on to when it is
switched off.
2. Since refuel
Display and storage of the values for the jour-
ney and the consumption. By refuelling, the
memory will be erased automatically. »1)
In the case of Gas (CNG) vehicles, the units are in
kg/h. 49
Page 52 of 88

CAR menu
3. Long-term
The memor y
r
ecords the values for a specific
number of partial trips, up to a total of 19
hours and 59 minutes or 99 hours and 59 mi-
nutes, or 1999.9 km (or miles) for 9999 km
(or miles), depending on the model of instru-
ment panel.
When one of these values is reached (de-
pending on the version of the instrument
panel), the memory is automatically deleted
and it starts counting from 0 again.
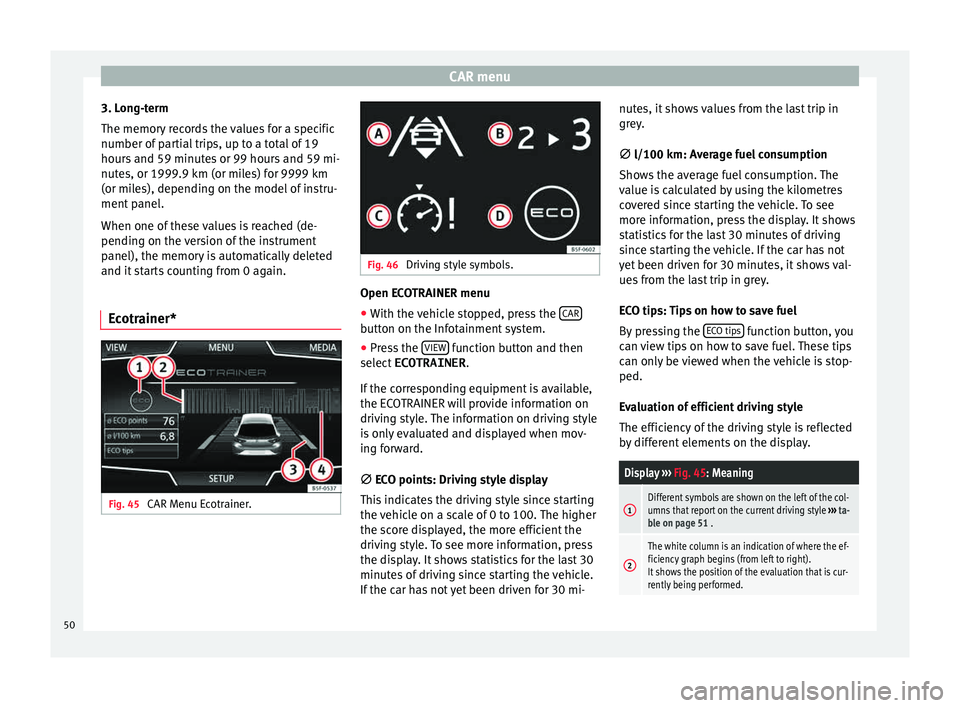
Ecotrainer* Fig. 45
CAR Menu Ecotrainer. Fig. 46
Driving style symbols. Open ECOTRAINER menu
● With the vehicle stopped, press the CAR button on the Infotainment system.
● Press the VIEW function button and then
sel ect
ECOTRAINER .
If
the corresponding equipment is available,
the ECOTRAINER will provide information on
driving style. The information on driving style
is only evaluated and displayed when mov-
ing forward.
∅ ECO points: Driving style display
This indicates the driving style since starting
the vehicle on a scale of 0 to 100. The higher
the score displayed, the more efficient the
driving style. To see more information, press
the display. It shows statistics for the last 30
minutes of driving since starting the vehicle.
If the car has not yet been driven for 30 mi- nutes, it shows values from the last trip in
grey.
∅
l/100 km: Average fuel consumption
Shows the average fuel consumption. The
value is calculated by using the kilometres
covered since starting the vehicle. To see
more information, press the display. It shows
statistics for the last 30 minutes of driving
since starting the vehicle. If the car has not
yet been driven for 30 minutes, it shows val-
ues from the last trip in grey.
ECO tips: Tips on how to save fuel
By pressing the ECO tips function button, you
c an
v
iew tips on how to save fuel. These tips
can only be viewed when the vehicle is stop-
ped.
Evaluation of efficient driving style
The efficiency of the driving style is reflected
by different elements on the display.
Display ››› Fig. 45: Meaning
1Different symbols are shown on the left of the col-
umns that report on the current driving style ››› ta-
ble on page 51 .
2
The white column is an indication of where the ef-
ficiency graph begins (from left to right).
It shows the position of the evaluation that is cur-
rently being performed. 50
Page 53 of 88

CAR menuDisplay
››› Fig. 45: Meaning
3
Bars to represent acceleration.
The position of the car represents the acceleration.
If speed is constant, the car remains in the central
area. When accelerating or braking, the car moves
forward or backward respectively.
4
Columns to show driving style efficiency.
On the horizon, the columns represent the effi-
ciency of the driving style in a retrospective man-
ner and move from left to right every five seconds
or so. The higher the height of the columns, the
more efficient the driving style.
The colour of the sky represents the average of the
last three minutes. The colour changes from grey
(less efficient) to blue (more efficient).
Symbols ››› Fig. 46: Meaning
AForesight when driving. If sudden changes of ac-
celeration occur, driving style efficiency is re-
duced.
BGear-change indicator.
CThe current vehicle speed is having a negative im-
pact on fuel consumption.
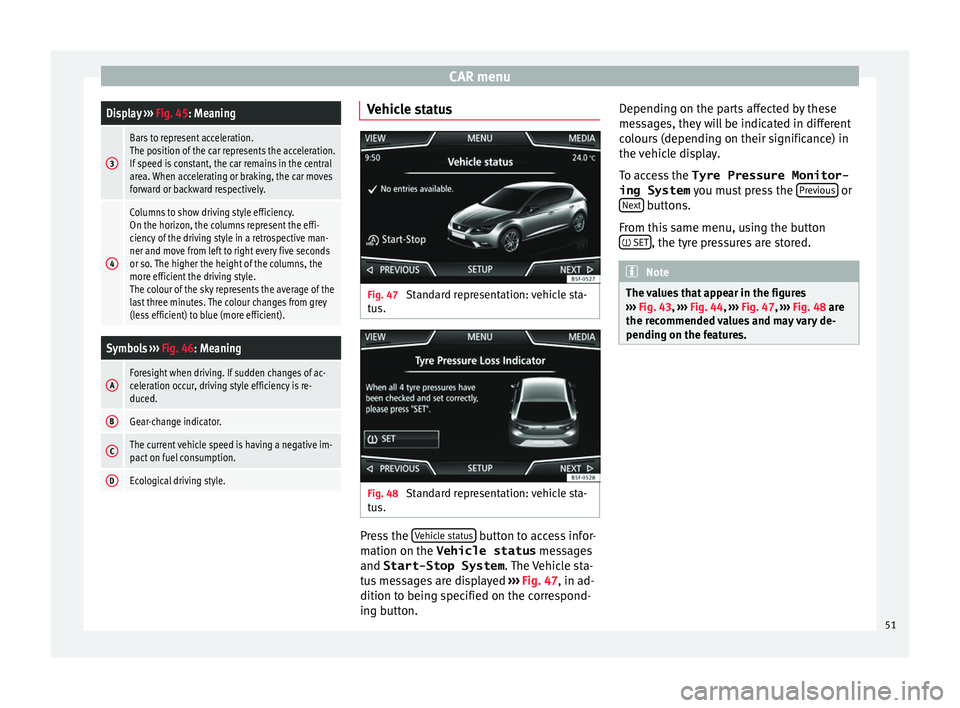
DEcological driving style. Vehicle status
Fig. 47
Standard representation: vehicle sta-
t u
s. Fig. 48
Standard representation: vehicle sta-
t u s. Press the
V
ehic
l
e status button to access infor-
m ation on the Vehicle status
me
s
sages
and Start-Stop System . The Vehicle sta-
tus messages are displayed ››› Fig. 47, in ad-
dition to being specified on the correspond-
ing button. Depending on the parts affected by these
mess
ages, they will be indicated in different
colours (depending on their significance) in
the vehicle display.
To access the Tyre Pressure Monitor-
ing System you must press the Previous or
Ne xt buttons.
Fr om thi
s
same menu, using the button
SET , the tyre pressures are stored.
Note
The values that appear in the figures
›› ›
Fig. 43, ››› Fig. 44, ››› Fig. 47, ››› Fig. 48 are
the recommended values and may vary de-
pending on the features. 51