2015 NISSAN GT-R change time
[x] Cancel search: change timePage 223 of 298
![NISSAN GT-R 2015 R35 Multi Function Display Owners Manual 8-24Voice recognition
INFO:
With [Continuous Learning] set to on, the
system does not go back to the command
list screen, allowing to continue voice
command learning by the system.
12. If the system h NISSAN GT-R 2015 R35 Multi Function Display Owners Manual 8-24Voice recognition
INFO:
With [Continuous Learning] set to on, the
system does not go back to the command
list screen, allowing to continue voice
command learning by the system.
12. If the system h](/manual-img/5/423/w960_423-222.png)
8-24Voice recognition
INFO:
With [Continuous Learning] set to on, the
system does not go back to the command
list screen, allowing to continue voice
command learning by the system.
12. If the system has learned the command correctly, “None” will change to “Stored”.
Editing registered items
It is possible to edit user names and select
learning function settings.
1. Push
2. Highlight [Others] and push
3. Highlight [Voice Recognition] and push
4. Highlight [Speaker Adaptation] and push
5. Highlight a user to edit, and push
6. Highlight [Setting] and push
7. Highlight an item to edit, and push
Setting items
.[Edit User Name]:
Edit the user name.
.[Delete Voice Data]:Reset the user voice that the voice
recognition system has learned.
.[Continuous Learning]:Have the system learn the voice com-
mands of the user in succession, without
selecting commands one by one.
VOICE COMMAND EXAMPLES
To use the voice recognition function, speaking
one command is sometimes sufficient, but at
other times it is necessary to speak two or more
commands. As examples, some additional basic
operations by voice commands are described
here.
Example 1: Switching map to 2D
(Plan View) mode
1. Push <>located on the steering wheel.
2. The system announces, “Please say a command”.
Page 234 of 298
5. When the vehicle is parked in the spacecompletely, move the shift lever to the
“P”(Park) position and apply the parking
brake
OPERATING TIPS
.When the shift lever is shifted to the “R”
(Reverse) position, the monitor screen auto-
matically changes to the RearView Monitor
mode. However, the radio can be heard.
. It may take some time until the RearView
Monitor is displayed after the shift lever has
been shifted to “R” from another position or
to another position from “R”. Objects may be
distorted momentarily until the RearView
Monitor screen is displayed completely.
. When the temperature is extremely high or
low, the screen may not clearly display
objects. This is not a malfunction.
. When strong light directly enters the cam-
era, objects may not be displayed clearly.
This is not a malfunction.
. The screen may flicker under fluorescent
light. This is not a malfunction.
. The colors of objects on the RearView
Monitor may differ somewhat from those of
the actual object. .
Objects on the monitor may not be clear in a
dark place or at night. This is not a
malfunction.
. If dirt, rain or snow attaches to the camera,
the RearView Monitor may not clearly dis-
play objects. Clean the camera.
. Do not use alcohol, benzine or thinner to
clean the camera. This will cause discolora-
tion. To clean the camera, wipe with a cloth
dampened with diluted mild cleaning agent
and then wipe with a dry cloth.
. Do not damage the camera as the monitor
screen may be adversely affected.
. Do not use wax on the camera window.
Wipe off any wax with a clean cloth
dampened with mild detergent diluted with
water.
Display of predictive course lines can be set to
ON or OFF.
If the rearview monitor is not in operation, set
according to the following procedure.
1. Push
2. Select [Others] and press
3. Select [Camera] and press
4. Select [Predictive Course Lines] and press
the item is set.
Monitor system9-7
CAMERA SETTINGS
Page 245 of 298
10-10Multi function meter
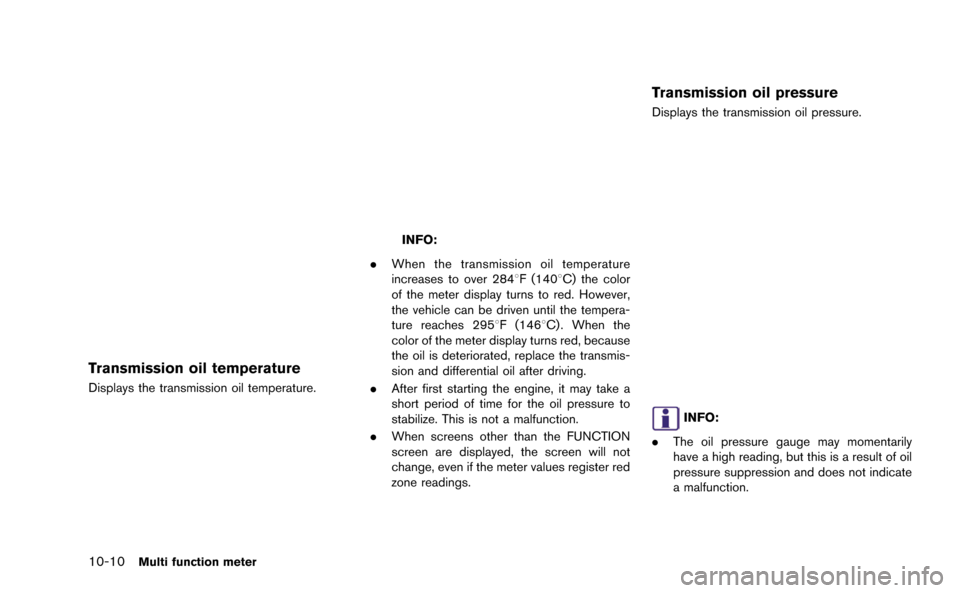
Transmission oil temperature
Displays the transmission oil temperature.
INFO:
. When the transmission oil temperature
increases to over 2848F (1408C) the color
of the meter display turns to red. However,
the vehicle can be driven until the tempera-
ture reaches 2958F (1468C) . When the
color of the meter display turns red, because
the oil is deteriorated, replace the transmis-
sion and differential oil after driving.
. After first starting the engine, it may take a
short period of time for the oil pressure to
stabilize. This is not a malfunction.
. When screens other than the FUNCTION
screen are displayed, the screen will not
change, even if the meter values register red
zone readings.
Transmission oil pressure
Displays the transmission oil pressure.
INFO:
. The oil pressure gauge may momentarily
have a high reading, but this is a result of oil
pressure suppression and does not indicate
a malfunction.
Page 252 of 298
INFO:
. The displayed clock time is set by the GPS
system.
. The clock time may not be displayed on the
screen when the system is not receiving a
GPS signal, even when the system is set to
display the time.
. You can choose to display the clock in the
12-hour/24-hour format.
“Clock settings” (page 7-7)
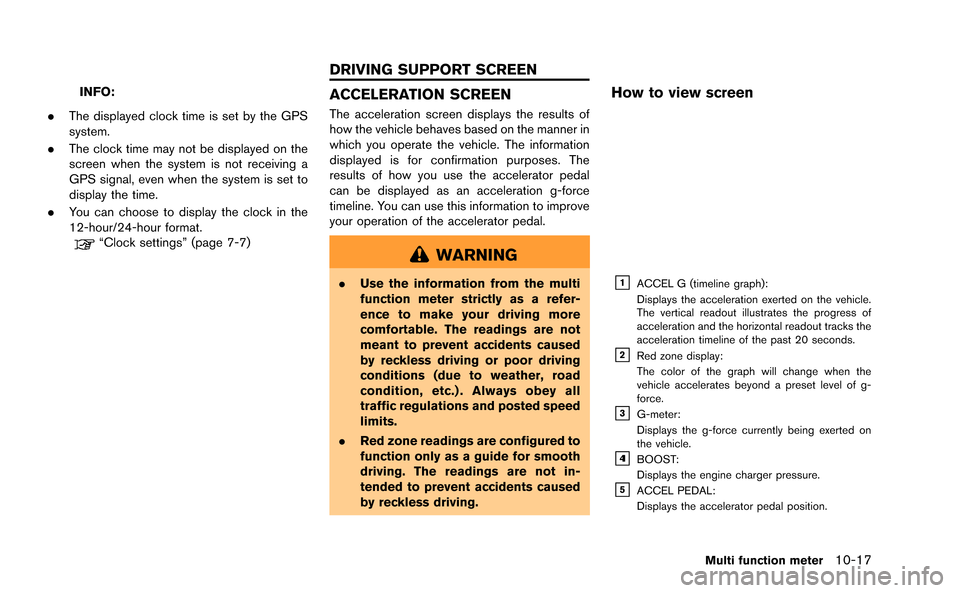
ACCELERATION SCREEN
The acceleration screen displays the results of
how the vehicle behaves based on the manner in
which you operate the vehicle. The information
displayed is for confirmation purposes. The
results of how you use the accelerator pedal
can be displayed as an acceleration g-force
timeline. You can use this information to improve
your operation of the accelerator pedal.
WARNING
.Use the information from the multi
function meter strictly as a refer-
ence to make your driving more
comfortable. The readings are not
meant to prevent accidents caused
by reckless driving or poor driving
conditions (due to weather, road
condition, etc.) . Always obey all
traffic regulations and posted speed
limits.
. Red zone readings are configured to
function only as a guide for smooth
driving. The readings are not in-
tended to prevent accidents caused
by reckless driving.
How to view screen
&1ACCEL G (timeline graph):
Displays the acceleration exerted on the vehicle.
The vertical readout illustrates the progress of
acceleration and the horizontal readout tracks the
acceleration timeline of the past 20 seconds.
&2Red zone display:
The color of the graph will change when the
vehicle accelerates beyond a preset level of g-
force.
&3G-meter:
Displays the g-force currently being exerted on
the vehicle.
&41BOOST:
Displays the engine charger pressure.
&5ACCEL PEDAL:
Displays the accelerator pedal position.
Multi function meter10-17
DRIVING SUPPORT SCREEN
Page 254 of 298
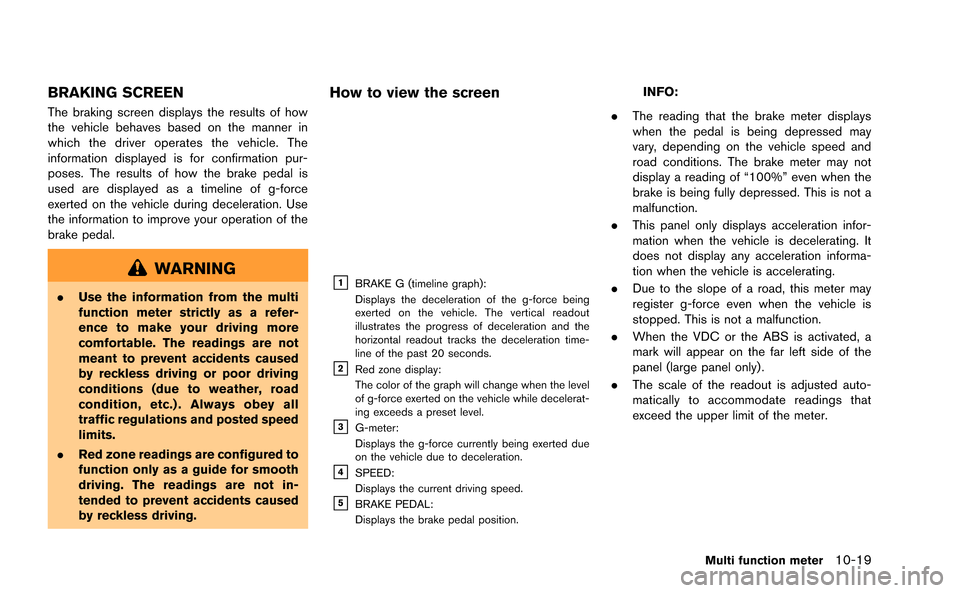
BRAKING SCREEN
The braking screen displays the results of how
the vehicle behaves based on the manner in
which the driver operates the vehicle. The
information displayed is for confirmation pur-
poses. The results of how the brake pedal is
used are displayed as a timeline of g-force
exerted on the vehicle during deceleration. Use
the information to improve your operation of the
brake pedal.
WARNING
.Use the information from the multi
function meter strictly as a refer-
ence to make your driving more
comfortable. The readings are not
meant to prevent accidents caused
by reckless driving or poor driving
conditions (due to weather, road
condition, etc.) . Always obey all
traffic regulations and posted speed
limits.
. Red zone readings are configured to
function only as a guide for smooth
driving. The readings are not in-
tended to prevent accidents caused
by reckless driving.
How to view the screen
&1BRAKE G (timeline graph):
Displays the deceleration of the g-force being
exerted on the vehicle. The vertical readout
illustrates the progress of deceleration and the
horizontal readout tracks the deceleration time-
line of the past 20 seconds.
&2Red zone display:
The color of the graph will change when the level
of g-force exerted on the vehicle while decelerat-
ing exceeds a preset level.
&3G-meter:
Displays the g-force currently being exerted due
on the vehicle due to deceleration.
&4SPEED:
Displays the current driving speed.
&5BRAKE PEDAL:
Displays the brake pedal position.
INFO:
. The reading that the brake meter displays
when the pedal is being depressed may
vary, depending on the vehicle speed and
road conditions. The brake meter may not
display a reading of “100%” even when the
brake is being fully depressed. This is not a
malfunction.
. This panel only displays acceleration infor-
mation when the vehicle is decelerating. It
does not display any acceleration informa-
tion when the vehicle is accelerating.
. Due to the slope of a road, this meter may
register g-force even when the vehicle is
stopped. This is not a malfunction.
. When the VDC or the ABS is activated, a
mark will appear on the far left side of the
panel (large panel only) .
. The scale of the readout is adjusted auto-
matically to accommodate readings that
exceed the upper limit of the meter.
Multi function meter10-19
Page 256 of 298
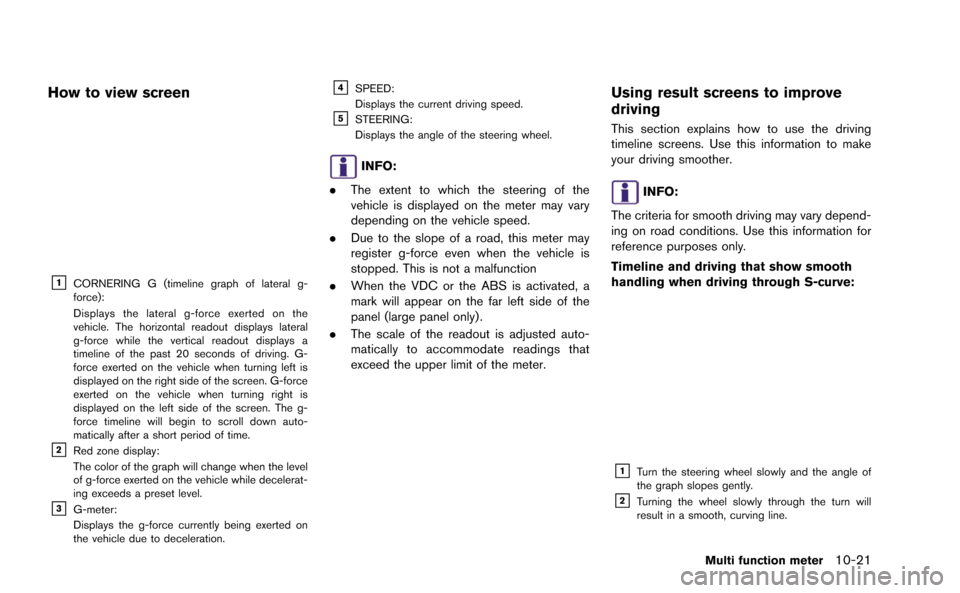
How to view screen
&1CORNERING G (timeline graph of lateral g-
force):
Displays the lateral g-force exerted on the
vehicle. The horizontal readout displays lateral
g-force while the vertical readout displays a
timeline of the past 20 seconds of driving. G-
force exerted on the vehicle when turning left is
displayed on the right side of the screen. G-force
exerted on the vehicle when turning right is
displayed on the left side of the screen. The g-
force timeline will begin to scroll down auto-
matically after a short period of time.
&2Red zone display:
The color of the graph will change when the level
of g-force exerted on the vehicle while decelerat-
ing exceeds a preset level.
&3G-meter:
Displays the g-force currently being exerted on
the vehicle due to deceleration.
&4SPEED:
Displays the current driving speed.
&5STEERING:
Displays the angle of the steering wheel.
INFO:
. The extent to which the steering of the
vehicle is displayed on the meter may vary
depending on the vehicle speed.
. Due to the slope of a road, this meter may
register g-force even when the vehicle is
stopped. This is not a malfunction
. When the VDC or the ABS is activated, a
mark will appear on the far left side of the
panel (large panel only) .
. The scale of the readout is adjusted auto-
matically to accommodate readings that
exceed the upper limit of the meter.
Using result screens to improve
driving
This section explains how to use the driving
timeline screens. Use this information to make
your driving smoother.
INFO:
The criteria for smooth driving may vary depend-
ing on road conditions. Use this information for
reference purposes only.
Timeline and driving that show smooth
handling when driving through S-curve:
&1Turn the steering wheel slowly and the angle of
the graph slopes gently.
&2Turning the wheel slowly through the turn will
result in a smooth, curving line.
Multi function meter10-21
Page 259 of 298
![NISSAN GT-R 2015 R35 Multi Function Display Owners Manual 10-24Multi function meter
3. Select [Stop Watch Times]. The details ofthe selected record will be displayed.
INFO:
You can use either the center dial or the touch
panel to scroll through the list.
Sav NISSAN GT-R 2015 R35 Multi Function Display Owners Manual 10-24Multi function meter
3. Select [Stop Watch Times]. The details ofthe selected record will be displayed.
INFO:
You can use either the center dial or the touch
panel to scroll through the list.
Sav](/manual-img/5/423/w960_423-258.png)
10-24Multi function meter
3. Select [Stop Watch Times]. The details ofthe selected record will be displayed.
INFO:
You can use either the center dial or the touch
panel to scroll through the list.
Saving to USB device
You can save the time records saved in the
system onto a USB device.
1. Insert the USB device in the media slot.
2. Select [TIME LOG]. The list screen will be displayed.
3. Select the record you would like to display.The menu screen will be displayed.
4. Select [Transfer Stop Watch data to USBMemory]. The time record is saved to the
USB device.
NOTICE
Inserting objects other than a USB
device into the USB connector can
cause damage. Do not insert anything
other than a USB device into the USB
connector.
INFO:
. Time records are saved to the USB device in
the CSV format.
. While records are being saved to the USB
device, do not change the key position or
remove the USB device.
Page 268 of 298
— If one section between waypoints cannotbe calculated, none of the route will be
displayed.
— The route may not connect completely at some waypoints.
— The route may require a U-turn close to some waypoints.
. Route calculation may not be completed in
the following cases.
— If there is no main road within a range of
1.5 miles (2.5 km) from the vehicle, a
message saying so will appear on the
screen. Try recalculating when the vehi-
cle is closer to a main road.
— If there is no main road within a range of 1.5 miles (2.5 km) from the destination or
waypoint, a message saying so will
appear on the screen. Try setting the
location closer to a main road.
— If the vehicle is too close to the destina- tion or if there are no roads to the
destination, a message saying so will
appear on the screen.
— If it is impossible to reach the destination or waypoints because of traffic regula-
tions, etc. — If the only route to reach the destination
or waypoints is extremely complicated.
— If the destination, current vehicle position or waypoint is within the “Avoid Area”.
— If a part of the route is included in the “Avoid Area”.
. The following may occur when the route is
displayed.
— If you calculate a route on a main road,
the starting point of the route may not
exactly match the current vehicle loca-
tion.
— The endpoint of the route may not exactly match the destination.
— If you calculate a route on a main road, the system may display a route from
another main road. This may be because
the position of the vehicle icon is not
accurate. In this case, park the vehicle in
a safe location and reset the vehicle icon,
or continue driving to see if the position
of the vehicle icon is automatically
adjusted before recalculating the route.
— There are cases in which the system shows an indirect route to reach the
destination or waypoints, if you set them
from stored or facility information. In
order to correct this, you must be careful
about the traffic direction, especially when lanes with different travel directions
are shown separately, such as inter-
changes and service areas.
— This system makes no distinction be- tween limited traffic control and total
control (blockage) . It may show an
indirect route even if the road is usable.
— Even if the freeway preference is set to OFF, a route that uses the freeway may
be suggested.
— Even if the ferry preference is set to OFF, a route that uses a ferry line may be
suggested.
— Ferry lines, excluding those that are only for pedestrians, bicycles and motor-
cycles, are stored in this system. Take
into consideration the travel time required
and operational condition before decid-
ing whether to use them or not.
General system information11-7