�µ
�µ
�µ
�µ
Fuel economy is not a f ixed number.
It varies based on driving conditions,
driving habits and vehicle condition.
Theref ore, it is not possible f or one
set of estimates to predict f uel
economy precisely f or all drivers in
all environments.
Represents urban
driving in light traf f ic. A range of
miles per gallon achieved is also
provided.
The EPA f uel economy estimates
shownintheexampletotheright
are a usef ul tool f or comparison
when buying a vehicle. EPA
estimates include:
Represents a combination of city and
highway driving. The scale
represents the range of combined
f uel economy f or other vehicles in
the class.
Represents a
mixture of rural and interstate
driving, in a warmed-up vehicle,
typical of longer trips in f ree-f lowing
traf f ic. A range of miles per gallon
achieved is also provided.
Provides an estimated annual f uel
cost, based on 15,000 miles (20,000
km) per year multiplied by the cost
pergallon(basedonEPAfuelcost
data) divided by the combined f uel
economy.
For more inf ormation on f uel
economy ratings and factors that
af f ect f uel economy, visit
(Canada: Visit
)
www.
fueleconomy.govwww.
vehicles.gc.ca
Fuel Economy
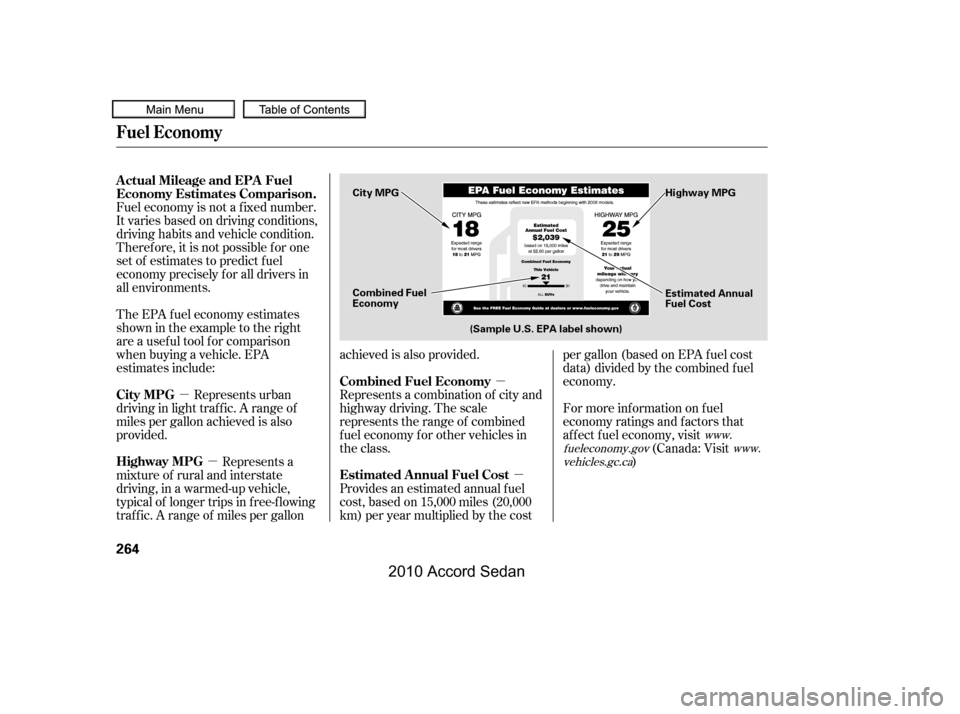
Actual Mileage and EPA Fuel
Economy Estimates Comparison.
City MPG
Combined Fuel Economy
Highway MPG
Estimated Annual Fuel Cost
264
Combined Fuel Economy
(Sample U.S. EPA label shown)
Estimated AnnualFuel Cost
City MPGHighway MPG
�����—�����—�
���y�
�������������y���
�)�����������y���������y
2010 Accord Sedan