1997 ASTON MARTIN DB7 engine
[x] Cancel search: enginePage 405 of 421

The Aston Martin Lagonda Diagnostic System
Users Guide
•=2?
Clear all Trouble Codes
Selecting the clear all trouble codes icon will invoke a
confirmation window.
EEC-V EMS
dri
dri
CONFIRM
Clear all logged trouble
codes?
O
'Clear
All Codes' confirmation
screen
Selectingthe'tick'will instructthePDU to clear all logged
trouble codes in the selected module
and
return to the no
logged codes screen.
Select the 'tick' icon to exit Diagnostic Trouble Codes.
Clear Selected Trouble Codes
(95 MY Zytek Engine Management Only))
If
you
wish only to clear selected codes on the Zytek ECU
and
leave others
for later
investigation,
proceed
as
follows:
Highlight only the trouble code(s) to be cleared.
ZYTEK EMS
1 : Idle speed control valve driver #1
5 : Purge Valve driver #1
12 : Cooling fan#l relay driver
14 : Lannda heater
#2
driver
1 : Idle speed control valve driver #1
Highlighting
Selected
Trouble
Codes
Select the 'clear selected trouble codes'
icon;
this will
invoke a confirmation window.
Selectingthe 'tick' icon will instruct
the
PDU to clear only
the selected trouble codes from the control module fault
table,
and if successful, the system will return to the
'Diagnostic trouble codes' screen.
If any attempt to clear trouble codes is unsuccessful, a
warning window will be displayed.
This will indicatethat
some selected
trouble codes remain
logged,selectingthe'tick'iconwillreturntothe'Diagnostic
trouble codes' screen.
Select the 'tick' icon again to exit Diagnostic Trouble
Codes.
9-54 September 1996
Page 406 of 421

"^I?
The Aston Martin Lagonda Diagnostic System
Users Guide
Datalogger
Introduction
Datalogger is software produced to identify permanent or
intermittent faults on vehicle electronics. The objective of
Datalogger is to provide a view of the vehicle's electrical
behaviour, such that intermittent activity can be recorded
and interpreted quickly and accurately. Running on the
Portable Diagnostic Unit (PDU), the Datalogger
appi ication can captu
re
vehicle information in three ways.
• Serial communications direct from the control unit.
• Parallel communications using the Interface Adaptor.
• Direct signal monitoringusingthemeasurementprobes.
Serial Communication
Serial Communication is a two-wire communication link
between the PDU and most vehicle control modules
providingdigital measurements forconnected components.
The serial communication link allows the tester to
determine the current condition of components connected
to the control module, and to identify any history of faults.
On later vehicles, the PDU is connected to the vehicle
diagnostic sockets via the mu
Iti
Protocol Adaptor (MPA) to
gather serial data from the control modules.
Parallel Communication
The Vehicle Interface Adapter (VIA) provides an interface
between the PDU and the vehicle harnesses for the
acquisition of multiple analogue measurements. The VIA
is
connected between the relevantvehicle control module
and it'sharness connector. Thisallows the PDU to captu re
information from a multitude of channels entering the
control module. This vehicle interface is used with control
modules not equipped with a serial communication link
(Teves Mk II braking system and the air conditioning
system).
Measurement Probes
The measurement probes permit readings to be taken
directly from any connector on the vehicle.
Datalogger Applications
Datalogger may be used to interrogate the following DB7
systems:
• ABS braking system controller
• Engine Management Controller
• Air Conditioning Controller
• Automatic Transmission Controller
• Passive Anti Theft (97 MY)
• Security System (97 MY)
Using the Datalogger
Configure the vehicle to the normal operating conditions
for the system under test.
From the PDU main menu screen:
Highlight 'Diagnostics'.
Press the 'tick' icon to confirm the selection.
Enter the Transmission Type and confirm the selection.
Select the Vehicle Area to be tested and confirm the
selection.
The PDU tools screen should now be displayed.
Highlight 'Datalogger'.
Confirm the selection with the 'tick'
icon.
The PDU connection screen should now be displayed.
Cable Setup
Upper Diagnostic Socl
PD\J Connections for Datalogger
Connect the PDU to the vehicle as described in the screen
image.
Switch On the ignition and press the 'tick'
icon.
September 1996 9-55
Page 410 of 421

^^?
The Aston Martin Lagonda Diagnostic System
Users Guide
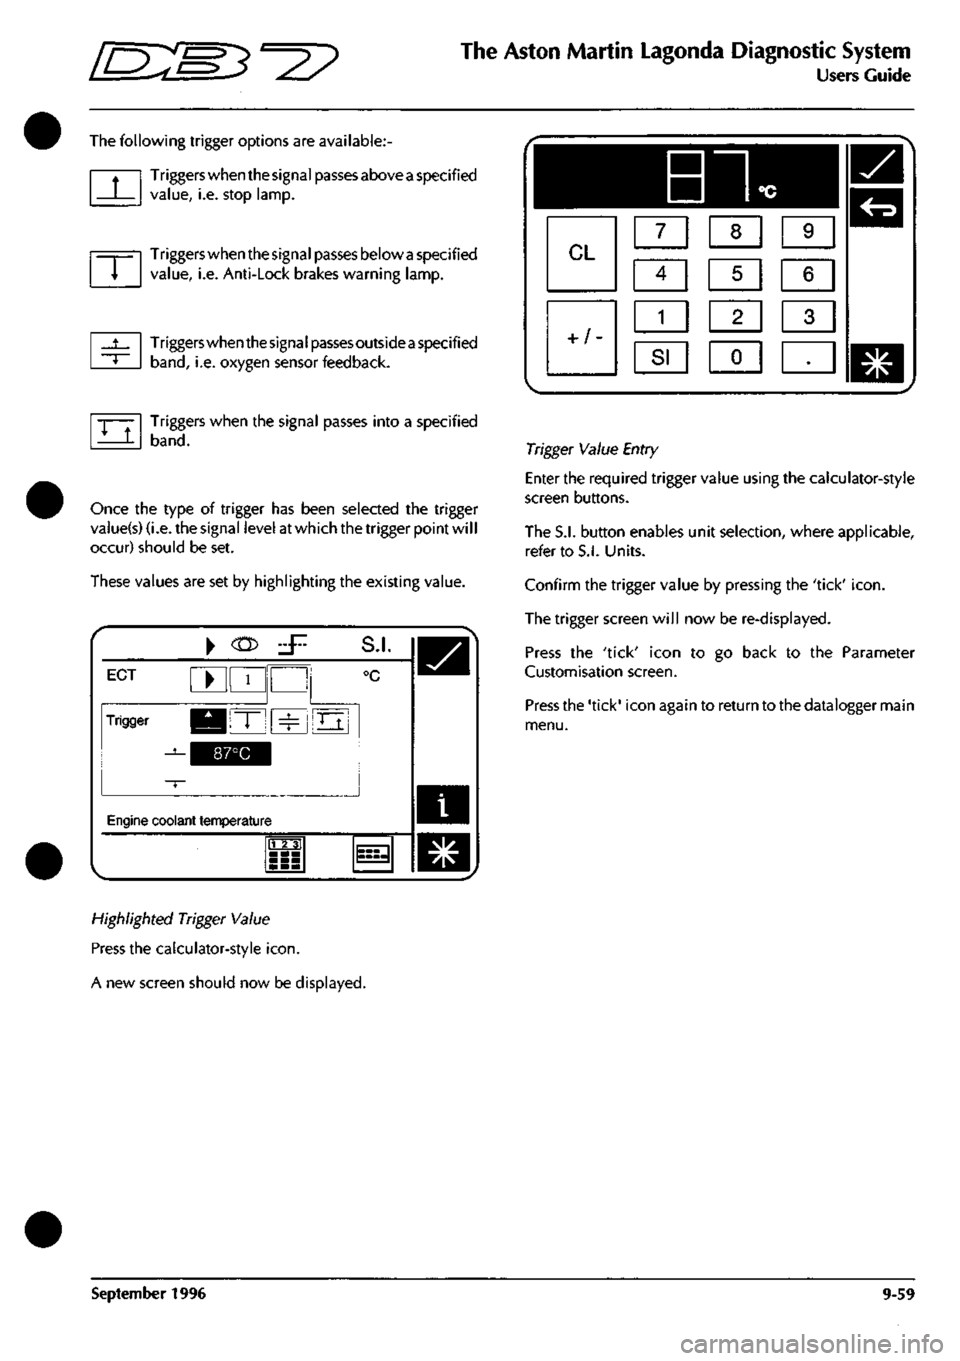
The following trigger options are available:
Triggers when the signal passes above
a
specified
value,
i.e. stop lamp.
Triggers when the signal passes below
a
specified
value,
i.e. Anti-Lock brakes warning lamp.
Triggers when the signa
I
passes outside
a
specified
band,
i.e. oxygen sensor feedback.
Triggers when the signal passes into a specified
band.
Once the type of trigger has been selected the trigger
vaiue(s) (i.e. the signal level at which the trigger point wil
I
occur) should be set.
These values are set by highlighting the existing value.
i
ECT ^ 1
Trigger KBIT" ^
^^^^1
S.I.
°c
Oj
Engine coolant temperature
m
^
Highlighted Trigger Value
Press the calculator-style
icon.
A new screen should now be displayed.
Trigger Value Entry
Enter the required trigger value using the calculator-style
screen buttons.
The S.I. button enables unit selection, where applicable,
refer to S.I. Units.
Confirm the trigger value by pressing the 'tick'
icon.
The trigger screen will now be re-displayed.
Press the 'tick' icon to go back to the Parameter
Customisation screen.
Press the 'tick' icon again to return to the datalogger main
menu.
September 1996 9-59
Page 417 of 421

The Aston Martin Lagonda Diagnostic System
Users Guide =2?
Training
The training programme incorporated into the PDU
software is designed to cover the needs of new users and
those who have basic PDU skills but require further
training on the DMM and Datalogger functions.
Select 'Training' from the PDU main menu to bring up the
training menu.
New User Training
The new user training program takes the student through
a structured sequence of activities to learn the meaning
and use of the basic screen icons. The traineemay then
work through programmed exercises to learn the digital
multi-meter and then the datalogger functions.
Existing User Training Menu
in this program the existing user may select training from
the following list:
• User Screen Controls
• Digital Multi-Meter
• Datalogger
OBD II Scan Tool (Not 95 MY)
The OBD II Scan Tool is designed to access the memories
of the engine and transmission control units to monitor
and extract data relative to emissions control.
The following types of data may be accessed:
Current Powertrain Data
Monitor Freeze Frame Data
Request Trouble Codes
Clear Trouble Codes
Request Oxygen Sensor Test Results
Monitor Oxygen Sensors
Display Pending Trouble Codes
Request On-Board Monitoring Test Results
Examine Readiness Tests
Malfunction Lamp Status
The data to be monitored is selected from the OBD
11
main
menu.
For example if Monitor Freeze Frame Data is selected, the
system will display up to 11 parameters which are always
recorded when a fault code is logged. The parameters are
as follows:
0 : SUPP Supported
2 : FCFF Fault Causing Freeze Frame
3 : FSS Fuel System Status
4 : CLV Calculated Load Value
5 : ECT Engine Coolant Temperature
6 : STFT-B1 Short Term Fuel Trim - bank 1 (Cyl
1
-3)
7 : LTFT-B1 Long Term Fuel Trim - bank
1
(Cyl 1-3)
8 : STFT-B2 Short Term Fuel Trim - bank 2 (Cyl 4-6)
9 : LTFT-B2 Long Term Fuel Trim - bank 2 (Cyl 4-6)
12:RPM .Engine Speed
13:VS Vehicle Speed
•'••) ••
Page 418 of 421

in:s3''^
The Aston Martin Lagonda Diagnostic System
Users Guide
#
Accessing Freeze Frame Data
The freeze frame data is vital in analysing unresolved
trouble codes. If an emissions related trouble code occurs,
complete a diagnostic trouble code report form including
the vehicle data, logged trouble codes and the freeze
frame data. Fax a copy of the form to Aston Martin Service
Operations Department who will assist in resolving the
concern.
To access freeze frame data, proceed as follows:
1.
Switch on the PDU and select 'Engine Diagnostics.
2.
Select 'OBD II Scan
Tool'.
The scan tool software
will load and the 'Cable Setup' screen will appear.
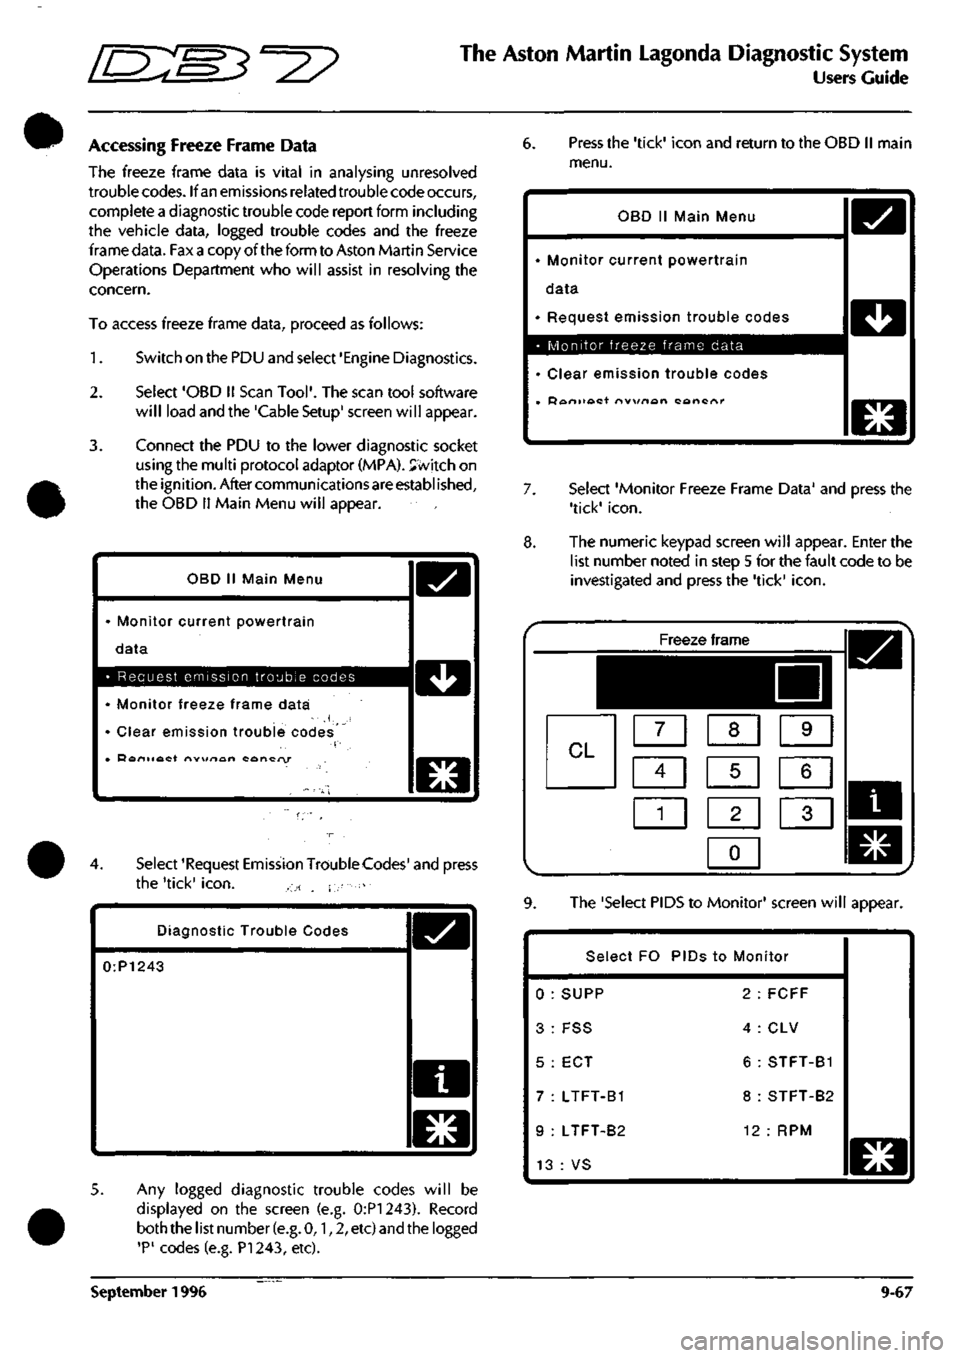
3. Connect the PDU to the lower diagnostic socket
using the multi protocol adaptor (MPA). Svvitch on
the ignition. After communications are established,
the OBD
11
Main Menu will appear.
OBD
11
Main Menu
• Monitor current powertrain
data
D
• Request emission trouble codes 1 ^^ 1
• Monitor freeze frame data
' Clear emission trouble codes
• Doniiact nw\/rtan concry
O
4.
Select 'Request Emission TroubleCodes' and press
the 'tick'
icon.
, ., - . i-
Diagnostic Trouble Codes
0:P1243
o
5. Any logged diagnostic trouble codes will be
displayed on the screen (e.g. 0:P1243). Record
both the list number
(e.g.
0,1,2, etc) and the logged
'P'
codes (e.g. PI 243, etc).
6. Press the 'tick' icon and return to the OBD II main
menu.
OBD II Main Menu
• Monitor current powertrain
data
• Request emission trouble codes
• Monitor freeze frame data
• Clear emission trouble codes
• Doniioct nvx/nort cancnr
D
D
O
7. Select 'Monitor Freeze Frame Data' and press the
'tick'
icon.
8. The numeric keypad screen will appear. Enter the
list number noted in step 5 for the fault code to be
investigated and press the 'tick'
icon.
Freeze frame
^^HHI
CL m [XI s
ci] s m
1
1 1 2 1 1 3 1
0
1
9. The 'Select PIDS to Monitor' screen will appear.
Select FO PIDs to Monitor
0 : SUPP 2 : FCFF
3: FSS 4:CLV
5 : ECT 6 : STFT-B1
7 : LTFT-B1 8 : STFT-B2
9 : LTFT-B2 12 : RPM
13 : VS
WWWM
o
September 1996 9-67